


GBP/USD TECHNICAL ANALYSIS – TALKING POINTS:
- British Pound may be ready to resume 12-year downtrend vs. US Dollar
- Possible top formation signaled by Bearish Engulfing candlestick pattern
- Daily close below neckline support sought to confirm initial breakdown
The British Pound may be on the cusp of resuming a downtrend in play against the US Dollar for over 12 years. The weekly chart reveals a dramatic Bearish Engulfing candlestick pattern produced at the intersection of falling trendline resistance and a horizontal barrier capping the upside since mid-September 2018, located in the 1.3300-81 area. This may prove to mark a top, ratifying a gloomy fundamental backdrop.
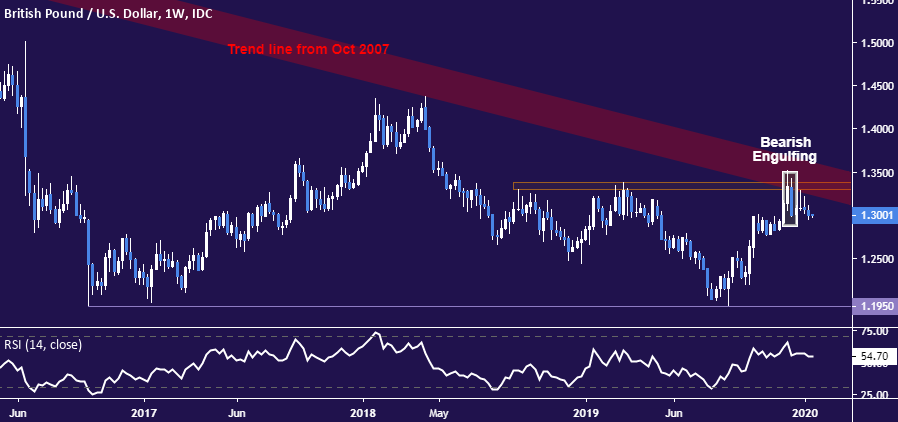
GBP/USD weekly chart created with TradingView

Zooming in to the daily chart, the makings of a reversal might be taking shape. Prices have broken past support traced along swing highs establishing the rise from early September 2019, lading atop a neckline limiting progress lower since November. A daily close below that seems likely to open the door for initial downside follow-through targeting the 1.2763-84 inflection region.

GBP/USD daily chart created with TradingView
Neutralizing immediate selling pressure probably requires a breach and close above steep falling resistance extending down from the December 13 high, now squarely at the 1.31 figure. Invaliding the broader case for long-term topping probably needs the bulls to show greater conviction however. Securing a foothold above 1.3381 would go a long way in that direction.
GBP/USD TRADER SENTIMENT
| Change in | Longs | Shorts | OI |
| Daily | -2% | -8% | -4% |
| Weekly | 5% | -8% | 0% |
GBP/USD TRADING RESOURCES
- Just getting started? See our beginners’ guide for FX traders
- Having trouble with your strategy? Here’s the #1 mistake that traders make
- Join a free webinar and have your questions answered
--- Written by Ilya Spivak, Currency Strategist for DailyFX.com
To contact Ilya, use the comments section below or @IlyaSpivak on Twitter


