


GBP/USD Technical Analysis
- British Pound price action against US Dollar.
- GBP/USD charts
Download for free our latest Q4 trading guides to help you build confidence when you trade on JPY, USD and other main currencies
GBP/USD Price – More Consolidation
On Nov 18, GBP/USD rallied towards 1.2985- its highest level in four weeks. Later, the price declined then continued its sideways move creating lower highs with higher lows.
The Relative Strength Index (RSI) declined from 67 however remained above 50, highlighting weak buyers and weaker sellers.
Just getting started? See our Beginners’ Guide for FX traders
GBP/USD DAILY PRICE CHART (Nov 9, 2017 – Nov 26, 2019) Zoomed out
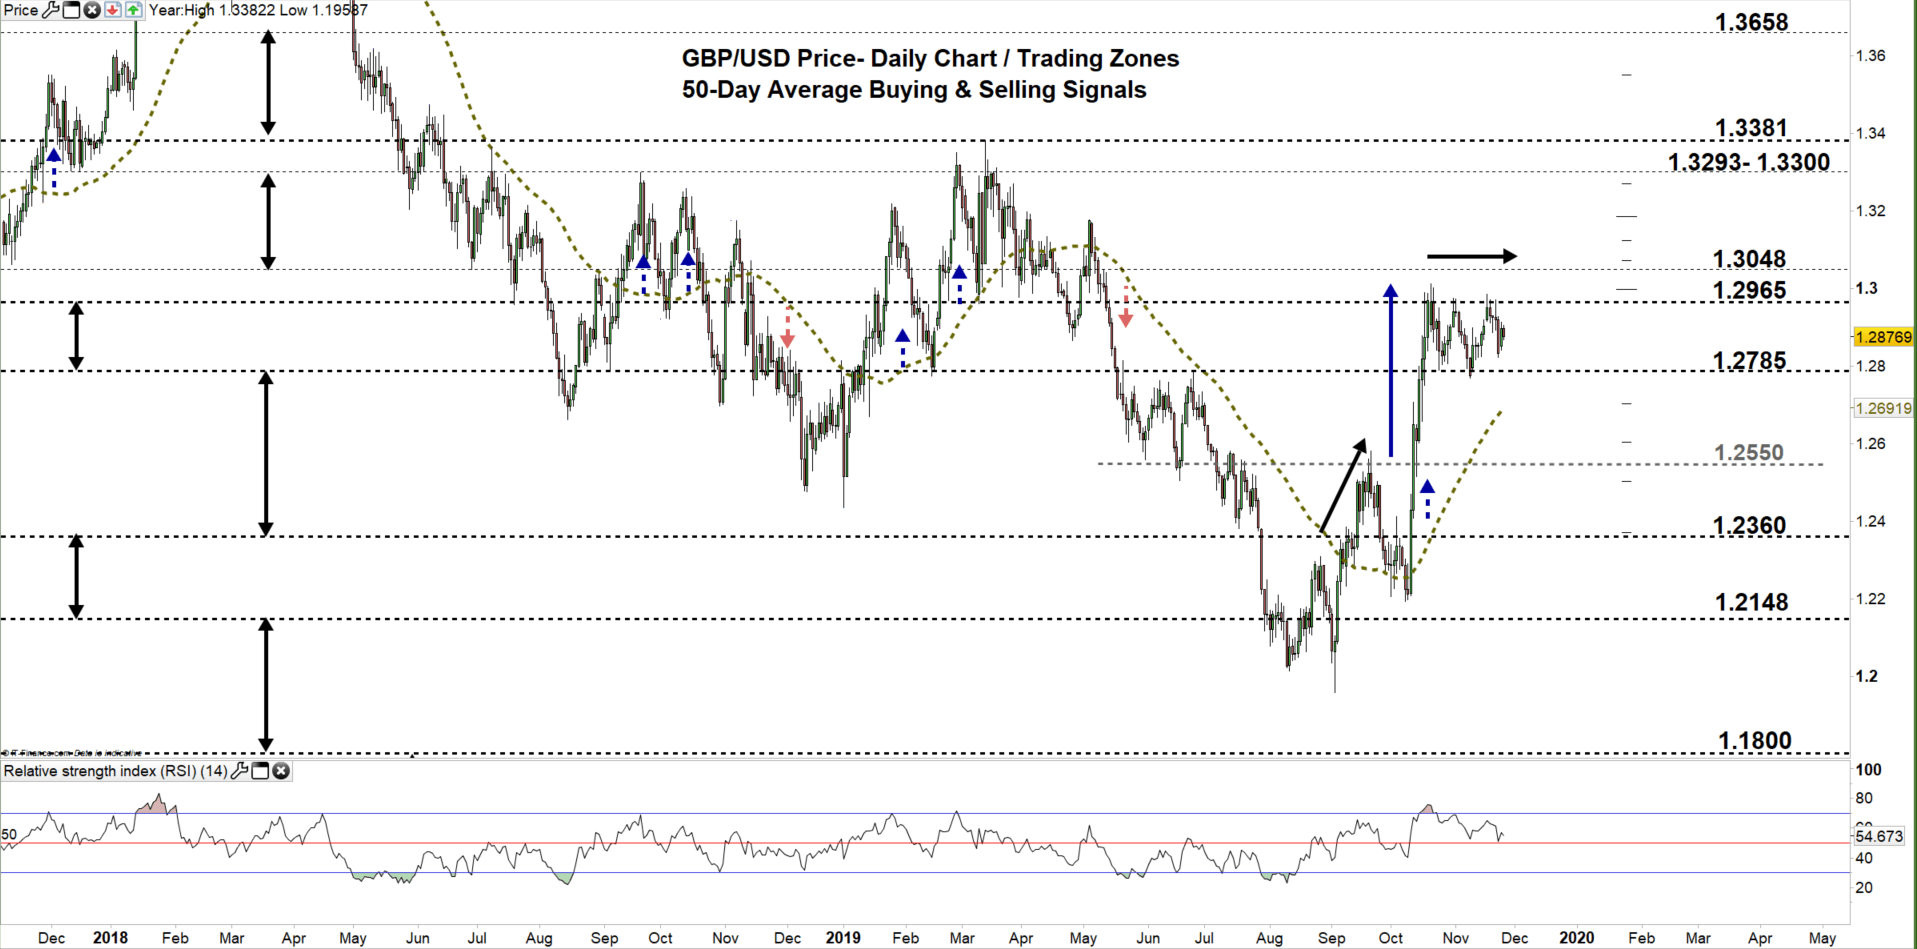
GBP/USD DAILY PRICE CHART (AUG 23 – Nov 26, 2019) Zoomed IN

From the daily chart, we notice last week GBP/USD failed in multiple occasions to rally to the higher trading zone. Currently, the price is still moving in the trading zone (1.2785- 1.2965) entered in Oct 16.
On Nov 21, the pair rebounded from the high end of the zone as buyers took profit at this stage allowing GBPUSD to reverse direction looking for a test of the low end of the zone.
Thus, a close below the low end of the zone could reflect more buyers exiting the market. This could open the door for sellers to take the lead and press towards 1.2550. In that scenario, the possible downtrend move may weaken at the support levels underlined on the chart (zoomed in) as some sellers may take profit at these points.
In turn, any failure in closing below the low end could mean buyers still holding positions. This could reverse the pair’s course and rally the price towards the high end of the zone. Further close above the high end could break the deadlock pushing GBPUSD towards 1.3048. Nevertheless, the weekly resistance levels underscored on the chart should be considered.
Read our last update to know more about the continuation pattern that could lead the price above 1.3150 in a further bullish scenario.
Having trouble with your trading strategy? Here’s the #1 Mistake That Traders Make
GBP/USD Four Hour PRICE CHART (Oct 1 – Nov 26, 2019)
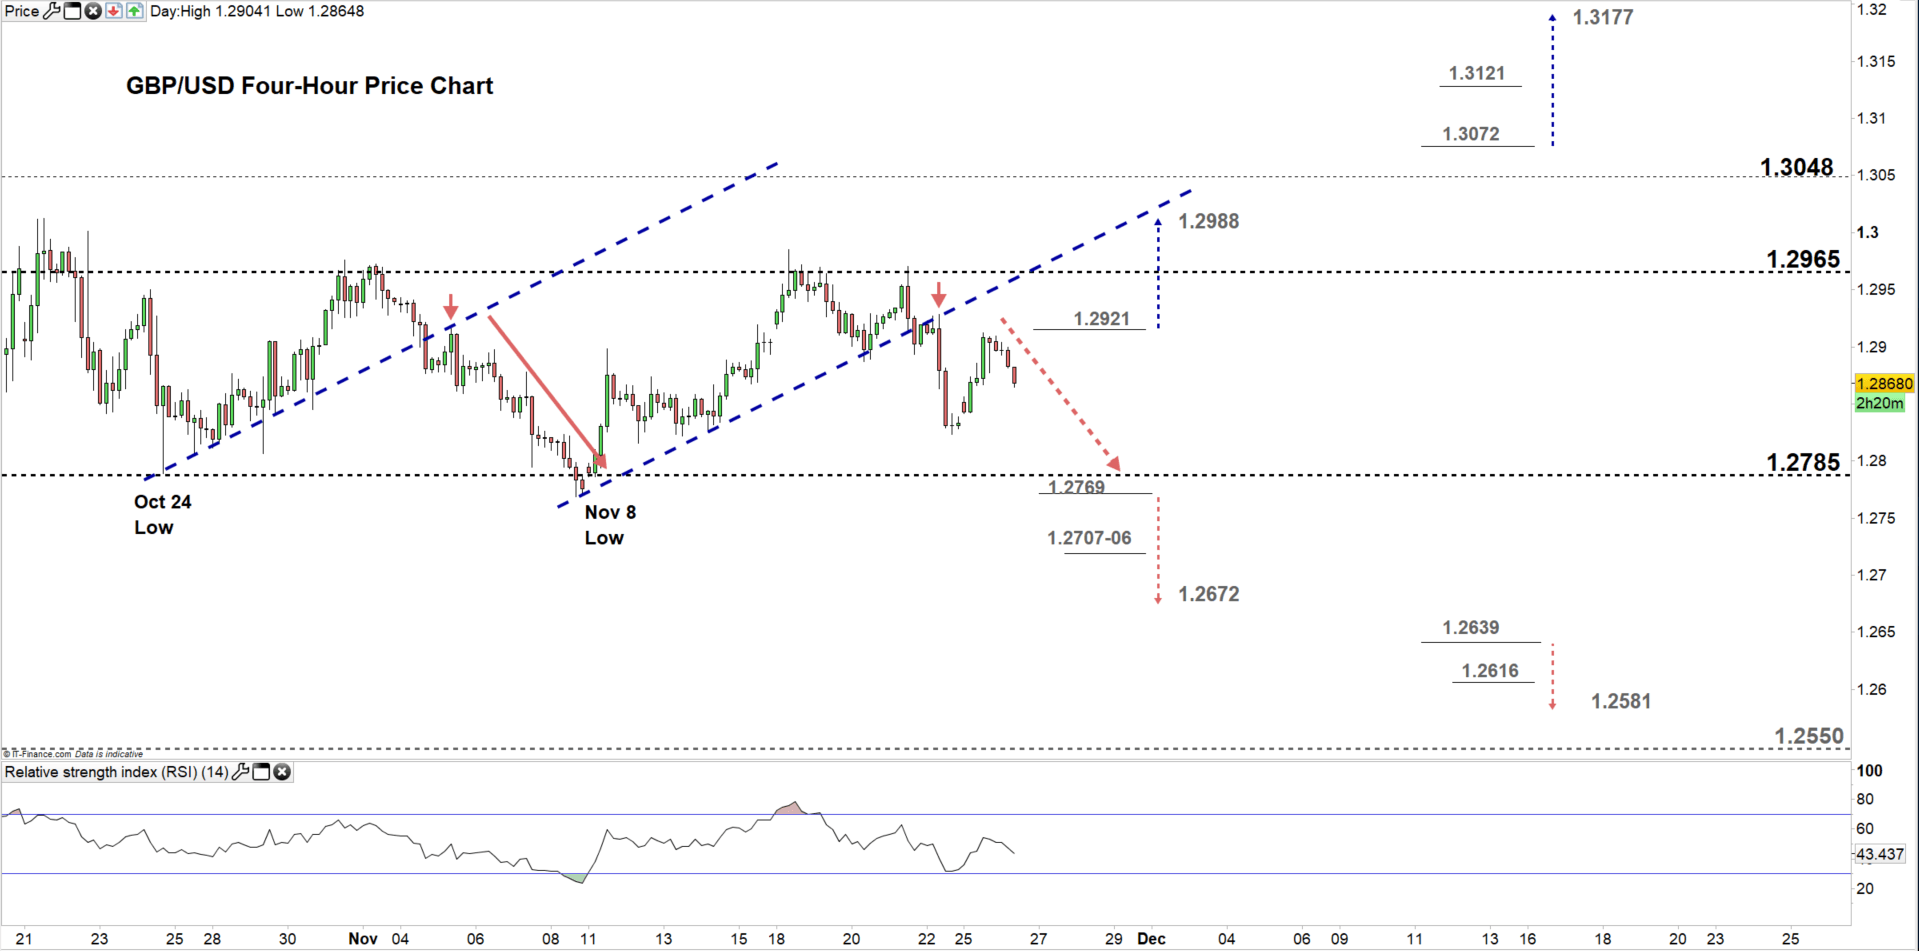
Looking at the four-hour chart, we notice on Nov 4 GBP/USD broke below the uptrend line originated from the Oct 24 low at 1.2788. On the following day the price rebounded from the uptrend line then declined towards the low end of the trading zone discussed above on the daily chart.
Last week, the price action repeated the same pattern i.e. broke below the uptrend line originated from the Nov 8 Low at 1.2769, then rebounded from the uptrend line on the following day eyeing a test of the low end of the low end of the trading zone.
Hence, a break below the Nov 8 Low could lead GBPUSD towards 1.2672. Although, the weekly support area marked on the chart should be kept in focus. On the other hand, a break above 1.2921 may send the price towards 1.2988. Yet, the high end of current trading zone mentioned above should be watched closely.
See the chart to find out more about key levels GBPUSD would encounter in a further bearish /bullish scenario.
Written By: Mahmoud Alkudsi
Please feel free to contact me on Twitter: @Malkudsi


