


GBP/USD Talking Points:
- GBP/USD price action is consolidating so far this week after last week’s topside run topped-out around Fibonacci resistance. So far, bulls have been able to defend price action above the 1.3000 psychological level, giving us two support bounces at 1.3030 over the past two trading days. But – bulls haven’t been able to make much ground when approaching prior highs, leading to the possibility of a deeper retracement before the topside move might be ready to continue.
- Expect Brexit headlines to continue eliciting volatility on both sides of the British Pound, and this could continue to produce jagged moves on either side of the market.
- Quarterly Forecasts have just been updated, and the Q3 forecast for GBP/USD is available from the DailyFX Trading Guides Page. If you’re looking to improve your trading approach, check out Traits of Successful Traders. And if you’re looking for an introductory primer to the Forex market, check out our New to FX Guide.
Want to see how retail traders are currently trading GBP/USD? Click here for GBP/USD Sentiment.
GBP/USD: Cable Holds Support as Dollar Bulls Craft Fresh Highs
The British Pound continues to show signs of recovery after the late-September slumber. This is when fears around Brexit, combined with a surge in the US Dollar helped to reverse a trend that had been in-play for much of the prior month. As we wrote, while that prior bullish move was far from consistent, the topside bias showed rather clearly as higher-highs and higher-lows continued to print, even with Brexit headlines creating ripples of volatility.
But that mood began to shift as we approached the end of Q3, and as Brexit headlines grew more negative, so did price action in the British Pound, eliciting a reversal that pulled prices below the psychological level at 1.3000.
Support eventually caught near the bottom of a zone that we followed for the bulk of Q3; first as resistance for bearish continuation and then as support after the trend had flipped. This zone runs from prior swings of 1.2918 up to 1.2956; and this helped to elicit a bounce last Wednesday that held into this week.
GBP/USD Four-Hour Price Chart

Chart prepared by James Stanley
We looked into GBP/USD coming into this week, hypothesizing that a breakdown in the US Dollar could make the topside of the pair attractive again. We used that level at 1.3117 Fibonacci level as a marker for bullish continuation, and after a quick test above to start this week, prices promptly pulled back and reversed approximately 100 pips.
But buyers came in ahead of a re-test of the 1.3000 level, and a similar such instance has shown with this morning’s price action. This has helped to produce an area of higher-low support at the 1.3030 level in GBP/USD.
GBP/USD 30-Minute Price Chart
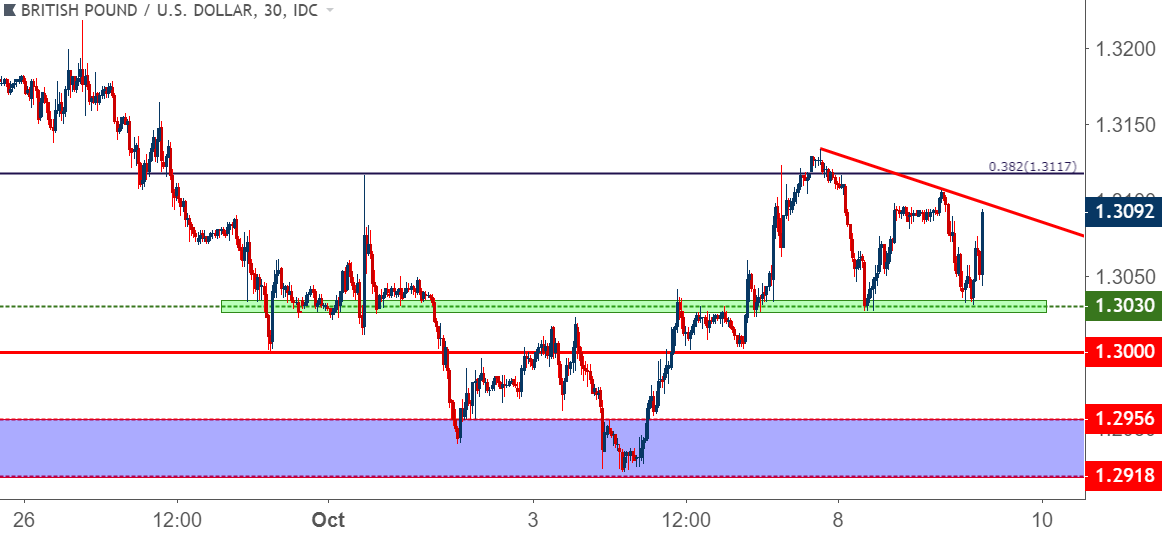
Chart prepared by James Stanley
GBP/USD Moving Forward
At this stage, the potential for bullish strategies remains as we’ve seen a respectable hold of support above the 1.3000 psychological level. But – the fact that bulls haven’t been able to make much ground while re-approaching prior highs makes the enthusiasm around bullish strategies a bit less attractive. This can open the door for two possible routes of moving forward with topside approaches. Traders can either await a break of chain of lower-highs that’s printed over the past few days: A topside breach above 1.3106. Or, alternatively, traders can look for a flush at current support of 1.3030 to find deeper support around the 1.3000 psychological level. And if we don’t find support around 1.3000, the bullish stance should be re-evaluated as something in the backdrop has likely shifted; whether that be GBP weakness on the back of Brexit headlines or US Dollar strength.
GBP/USD Hourly Price Chart
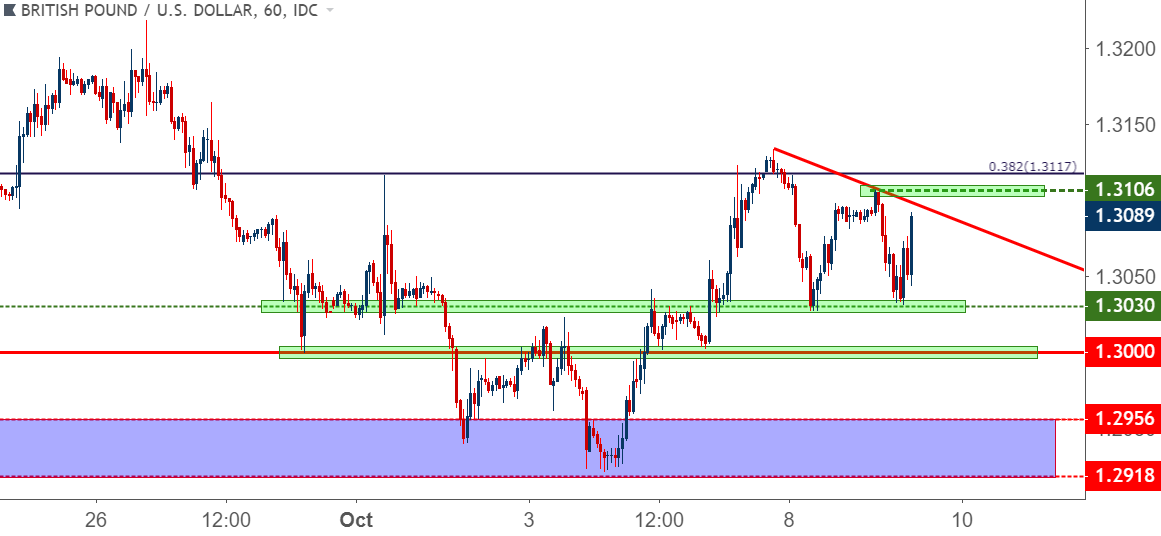
Chart prepared by James Stanley
To read more:
Are you looking for longer-term analysis on the U.S. Dollar? Our DailyFX Forecasts for Q1 have a section for each major currency, and we also offer a plethora of resources on USD-pairs such as EUR/USD, GBP/USD, USD/JPY, AUD/USD. Traders can also stay up with near-term positioning via our IG Client Sentiment Indicator.
Forex Trading Resources
DailyFX offers a plethora of tools, indicators and resources to help traders. For those looking for trading ideas, our IG Client Sentiment shows the positioning of retail traders with actual live trades and positions. Our trading guides bring our DailyFX Quarterly Forecasts and our Top Trading Opportunities; and our real-time news feed has intra-day interactions from the DailyFX team. And if you’re looking for real-time analysis, our DailyFX Webinars offer numerous sessions each week in which you can see how and why we’re looking at what we’re looking at.
If you’re looking for educational information, our New to FX guide is there to help new(er) traders while our Traits of Successful Traders research is built to help sharpen the skill set by focusing on risk and trade management.
--- Written by James Stanley, Strategist for DailyFX.com
Contact and follow James on Twitter: @JStanleyFX


