


GBP/USD Talking Points:
- The British Pound continues to hold on to September gains despite a headline-driven sell-off in the latter portion of last week. The support level we looked at came into play as the Friday low which held into this week before buyers pushed a bounce in the pair. At this point, GBP/USD is holding support at a key Fibonacci level of 1.3117, but this may be a trap and traders would likely want to treat this observation with extreme caution until more information can be had.
- While a weak US Dollar and a stronger economic backdrop could support continued GBP gains, this is a headline-driven scenario that we’re dealing with as there is still very little clarity around Brexit negotiations. Traders speculating in GBP pairs will likely want to take into account the potential for continued two-way volatility as this theme remains in the spotlight.
- Quarterly Forecasts have just been updated, and the Q3 forecast for GBP/USD is available from the DailyFX Trading Guides Page. If you’re looking to improve your trading approach, check out Traits of Successful Traders. And if you’re looking for an introductory primer to the Forex market, check out our New to FX Guide.
Want to see how retail traders are currently trading GBP/USD? Click here for GBP/USD Sentiment.
GBP Volatility Remains as Brexit Headlines Drive the Flow
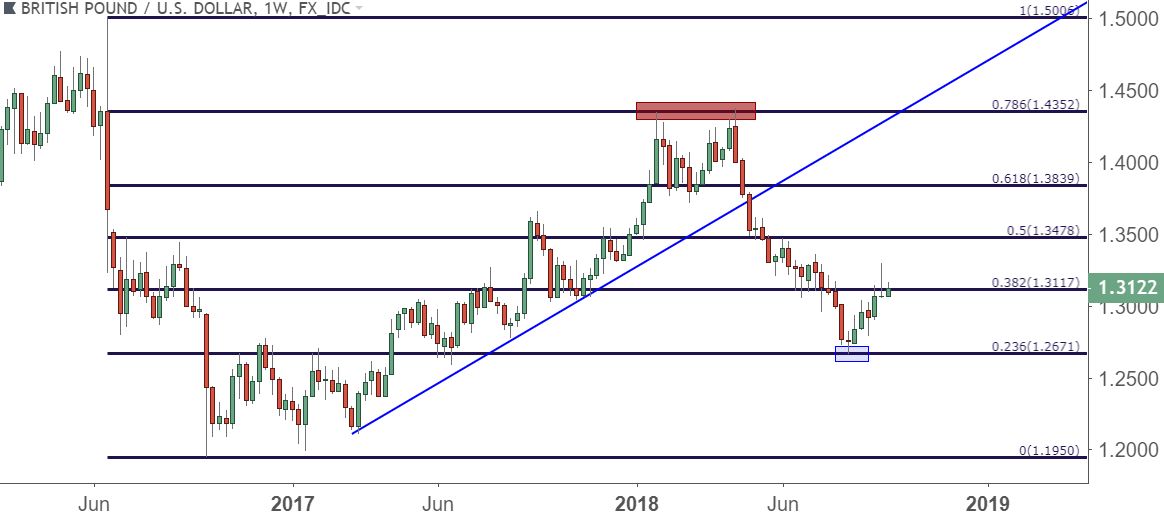
It’s been a climactic past month of price action in the British Pound. As we walked into the final week of August, GBP/USD was continuing to hold on to the sell-off that had driven the currency for much of the prior four months. Prices had just sunk down to find support at the 23.6% Fibonacci retracement of the Brexit-move, and this was a more than 1,500 pips away from where the pair had topped-out at in mid-April. There was little by way of positivity at the time.
The first half of August was particularly brutal, when a BoE rate hike early in the month served to only hasten the declines. Sellers remained in-charge as a very uncertain future defined the outlook for the British Pound, and there was little apparent hope as Brexit negotiations drew near. We started to look at bullish setups in GBP/USD in mid-August largely on the basis of just how negative everything had become; looking for prices to pullback in the down-trend after oversold readings began to flash on both Daily and Weekly RSI readings.
But not more than two weeks after that support bounce had showed up, we saw a potentially game-changing factor come to light. This is when the EU’s Chief Negotiator, Michael Barnier, mentioned that the EU would be open to a post-Brexit partnership with the UK. And while the ride has been far from smooth, that bullish behavior in the currency has continued to show through the month of September after this announcement was made.
GBP/USD Four-Hour Price Chart: A Reversal of Fortunes After the Mid-August Low

We shifted our bias on the pair as we came into September, largely on the back of the apparent mood shift that had taken place in the market as fears around Hard-Brexit or No-Deal Brexit had started to calm. For most of the month, we’ve been looking for higher-low support and signs of bullish continuation.
Of recent, one of those big items for bullish continuation has been the re-engagement of the 38.2% level from the Brexit move. This level takes place at 1.3117, and previously this helped to hold support on the pair in June and July, just before the intense selling took place in early-August. More recently, this level came back into play as short-term resistance two weeks ago, followed by an iteration of short-term support last week.
GBP/USD Weekly Price Chart: April Resistance at 78.6, August Support at 23.6, Now Back to 38.2
In our last article, we wanted to avoid using this level for higher-low support, instead looking for a deeper zone of support potential to come into play. That zone ran from 1.3034-1.3065, and this helped to mark the Friday low that has held into this week.
As we move deeper into the final week of Q3, that stance remains. While the idea of higher-low support holding at current levels appears as attractive, the fact remains that we may be looking at a deeper retracement before longer-term, bigger-picture bullish continuation is ready to go. At the very least, a re-test of this support zone would keep the door open for stops below the 1.3000 big figure.
Traders should also look to keep risk on topside setups very light; as we’re likely going to continue to see headline-driven volatility, and that can most certainly work in both directions. Last week we saw a brutal sell-off in the latter portion of the week that brought this support into play. Calm has shown so far this week, but this is a political conundrum that is unlikely to soon find clarity so, expect volatility around any GBP setups as we move into Q4.
GBP/USD Hourly Price Chart: Deeper Support Potential
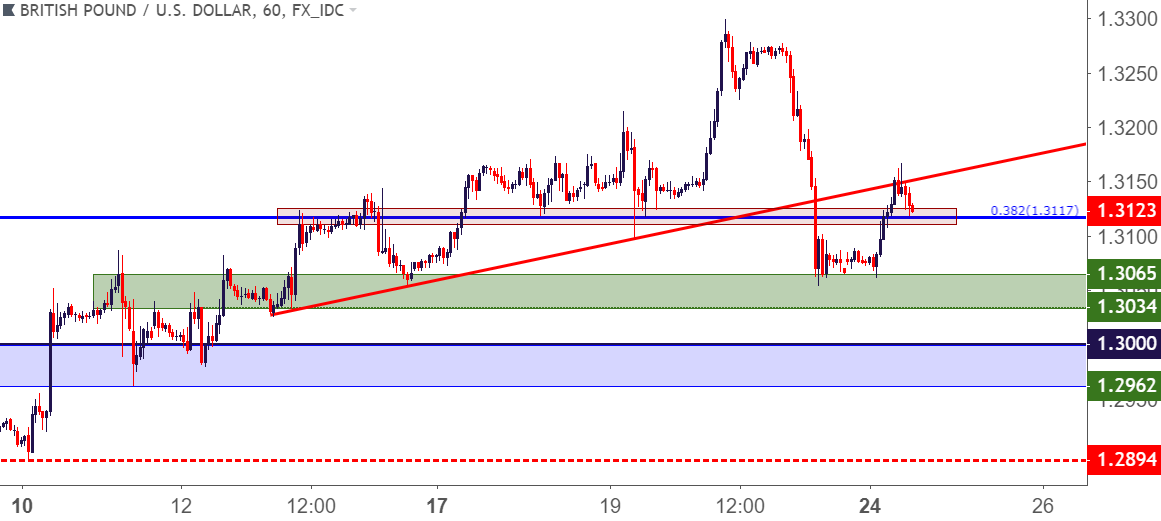
Chart prepared by James Stanley
To read more:
Are you looking for longer-term analysis on the U.S. Dollar? Our DailyFX Forecasts for Q1 have a section for each major currency, and we also offer a plethora of resources on USD-pairs such as EUR/USD, GBP/USD, USD/JPY, AUD/USD. Traders can also stay up with near-term positioning via our IG Client Sentiment Indicator.
Forex Trading Resources
DailyFX offers a plethora of tools, indicators and resources to help traders. For those looking for trading ideas, our IG Client Sentiment shows the positioning of retail traders with actual live trades and positions. Our trading guides bring our DailyFX Quarterly Forecasts and our Top Trading Opportunities; and our real-time news feed has intra-day interactions from the DailyFX team. And if you’re looking for real-time analysis, our DailyFX Webinars offer numerous sessions each week in which you can see how and why we’re looking at what we’re looking at.
If you’re looking for educational information, our New to FX guide is there to help new(er) traders while our Traits of Successful Traders research is built to help sharpen the skill set by focusing on risk and trade management.
--- Written by James Stanley, Strategist for DailyFX.com
Contact and follow James on Twitter: @JStanleyFX


