


GBP/USD Talking Points:
- The British Pound is back above 1.3000 for the third time in the past week-and-a-half, again being driven-higher after some upbeat comments from the EU’s Chief Negotiator, Michael Barnier. This hasn’t been a one-way show, however, as price action has remained whippy in both directions over the past week as Brexit-headlines drive GBP order flow.
- The backdrop for continued strength could be solidifying, particularly if we do see cessation of the Hard-Brexit or No-Deal Brexit fears that had taken over the pair’s price action earlier this summer. A sustained move above 1.3000 will be needed to convince that the current move of strength is anything more than short-cover; but that backdrop appears to be building in front of us.
- Quarterly Forecasts have just been updated, and the Q3 forecast for GBP/USD is available from the DailyFX Trading Guides Page. If you’re looking to improve your trading approach, check out Traits of Successful Traders. And if you’re looking for an introductory primer to the Forex market, check out our New to FX Guide.
Want to see how retail traders are currently trading GBP/USD? Click here for GBP/USD Sentiment.
GBP/USD Back Above 1.3000 After Optimistic Barnier Comments, Part 2
Volatility in the British Pound has extended into a new week, and much as we saw two weeks ago, GBP/USD is testing above the key 1.3000 level after some optimistic comments from the EU’s Chief Negotiator, Michael Barnier. That prior move above 1.3000 was reversed just a few trading days later, with GBP/USD catching support at 1.2800. Bulls soon returned as more positive headlines began to show, and this morning sees GBP catching a bid after another round of upbeat commentary from Mr. Barnier. As we wrote last week, Brexit-driven headlines are pushing GBP in both directions, and this makes for a difficult environment for short-term traders and strategies.
GBP/USD Four-Hour Price Chart: Choppy Price Action as Brexit-Headlines Drive the Flow
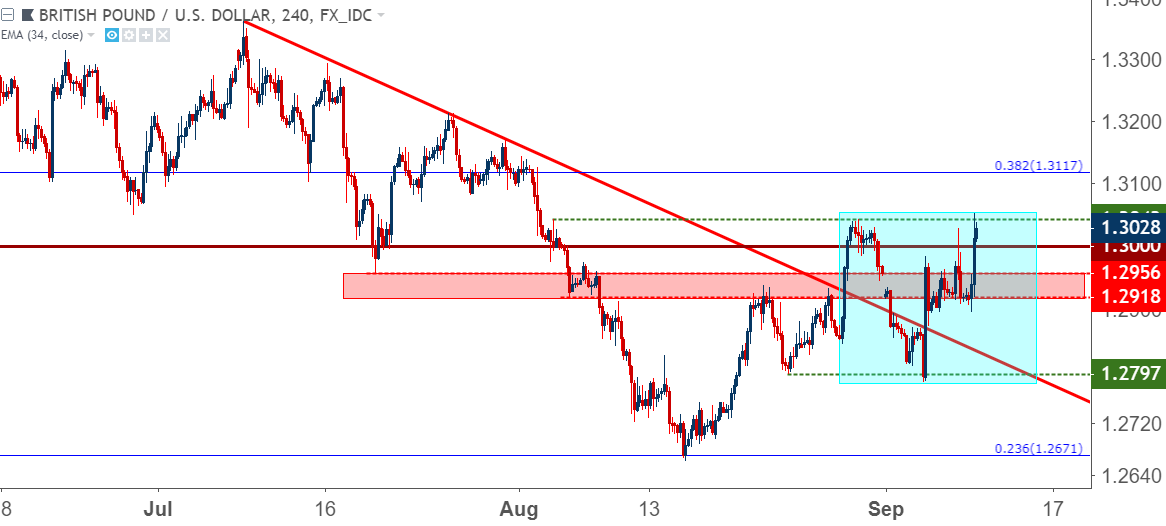
Chart prepared by James Stanley
GBP/USD Longer-Term Direction
The big question around GBP/USD at the moment is whether we’re at the early stages of reversal from the four-month down-trend. Coming into 2018, GBP/USD was holding on to a trend that had lasted for most of last year. That theme of Cable strength ran all the way into mid-April, at which point disappointing inflation figures brought a more-dovish BoE which, in-turn, helped to push prices in GBP lower.
But after the May Super Thursday rate decision, it started to appear that fears around a Hard-Brexit or No-Deal Brexit scenario had taken over, and even when the Bank of England hiked rates in early-August, sellers remained in-control; pushing GBP/USD to fresh yearly lows until a key Fibonacci level came into play in the middle of last month. This is the 23.6% Fibonacci retracement of the ‘Brexit move’ in the pair, and the 78.6% retracement of this same study helped to mark the GBP/USD top in mid-April.
GBP/USD Weekly Price Chart
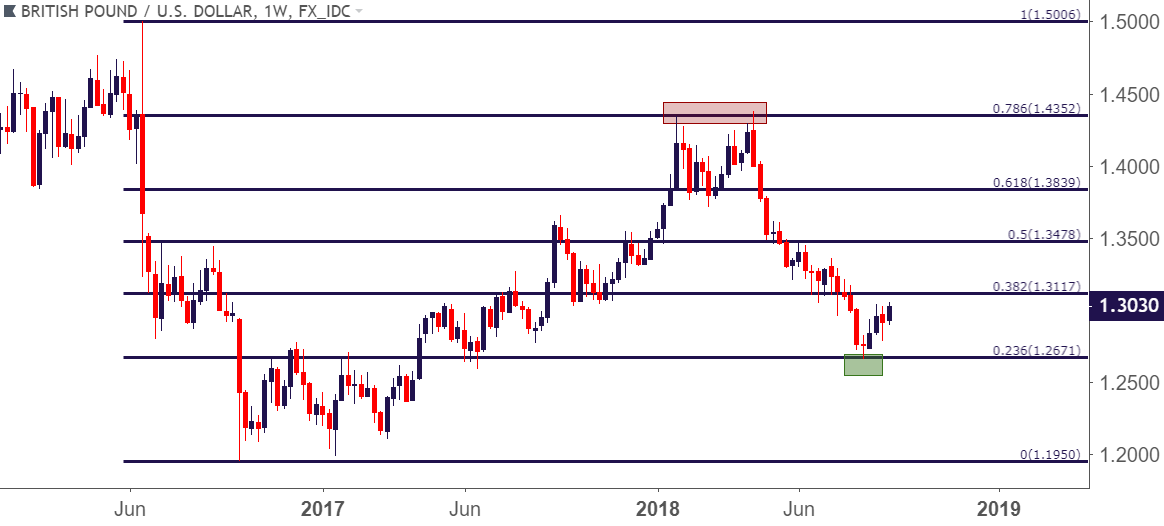
Chart prepared by James Stanley
Can Buyers Continue Pushing to Create a Fresh Bullish Trend?
Last month we looked at support plays in GBP/USD largely based on how oversold the pair had become combined with this long-term support. But when Mr. Barnier shared those surprise comments two weeks ago, that support bounce had the potential to turn into something more. As we wrote at the time, a softened stance out of the EU ahead of Brexit negotiations had the potential to shift the tide of pessimism that had surrounded GBP/USD for much of the prior four months.
We began looking for bigger-picture themes of strength in GBP/USD as we came into September, and after a whippy start to the month, GBP/USD price action remains in a position that could keep the door open for bullish strategies and further rallies. The backdrop is not yet clean, as we’re seeing continued resistance at the same 1.3043 level that we had warned of shortly after Mr. Barnier’s initial set of comments.
Also of note for bullish strategies and something that we touched on this morning: A portion of this topside theme is likely emanating from short-cover. The moves-higher on the GBP/USD chart have been sharp and quick to the upside while moves-lower have been slower and more orchestrated. This indicates that we’re seeing some element of shorts covering as these positive items hit the headlines; and this is something that makes the prospect of a longer-term bullish shift less attractive.
GBP/USD Hourly Price Chart: Topside Moves Sharp and Fast, Indicating Short Cover as Positive Items Hit Headlines
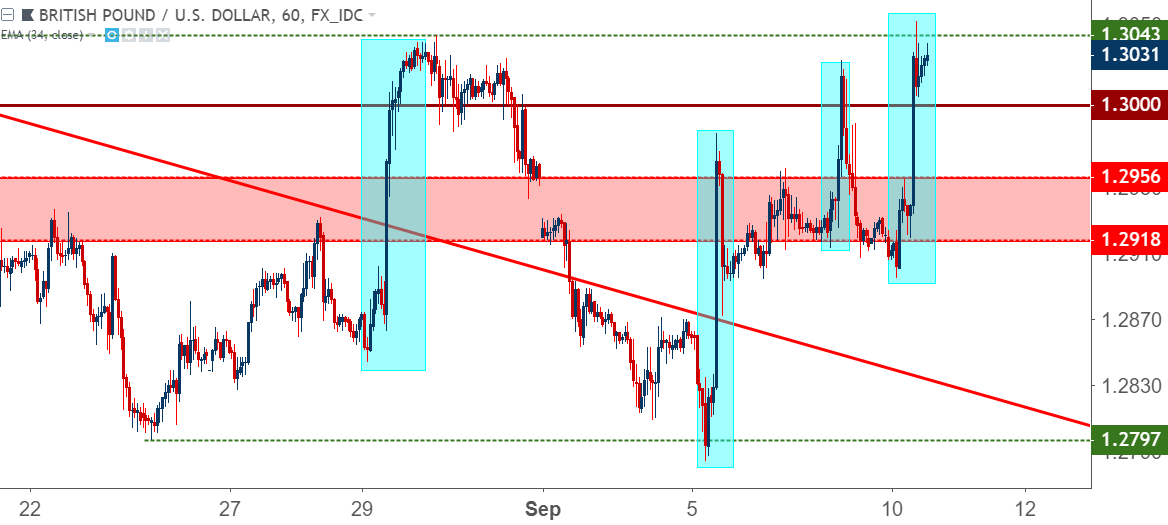
Chart prepared by James Stanley
But – most bullish trends or reversals start off with short covering from the prior bearish trend; and this may be what we’re witnessing now in GBP/USD as tensions ease around what was looking to be an acrimonious split between the EU and UK. As such, traders can take a step back to let the bigger picture trend show additional confirmation that a shift is taking place, and at this stage the key will be seeing a sustained topside move above that 1.3043 level that we looked at two weeks ago. This morning brought another false breakout through the level, and it looks as though bulls may continue to push.
For those convinced enough of the potential for bullish continuation, the support zone that runs from 1.2915-1.2956 can be used to look for higher-low support, just as we had looked at last week.
For those looking to take a more conservative approach to the matter, letting prices re-test the 38.2% retracement of the Brexit-move at 1.3117 could make the prospect of bullish continuation look considerably more attractive; and this could also open the door for a test of higher-low support off of the psychological level of 1.3000.
GBP/USD Four-Hour Price Chart
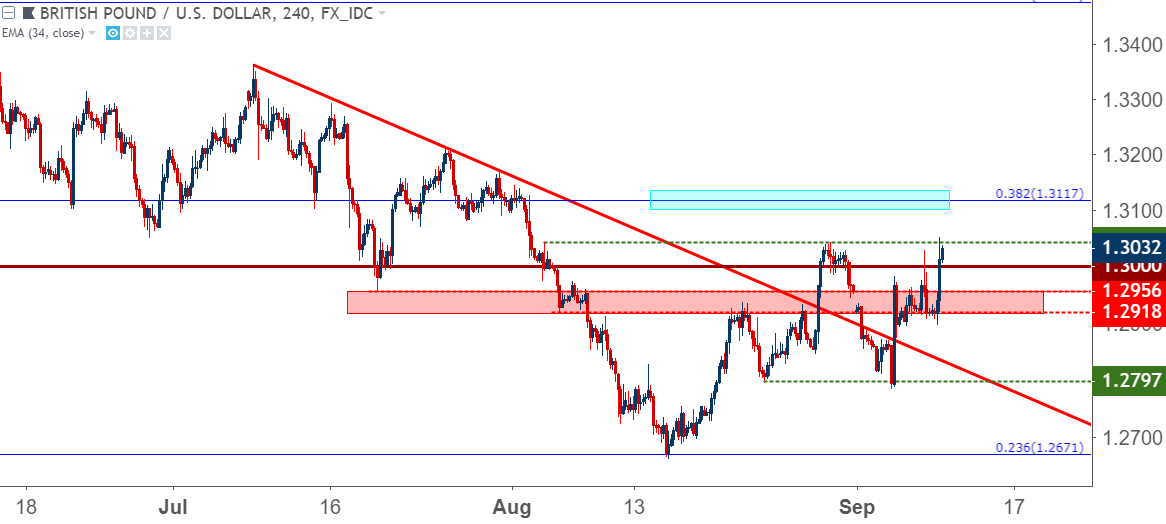
Chart prepared by James Stanley
To read more:
Are you looking for longer-term analysis on the U.S. Dollar? Our DailyFX Forecasts for Q1 have a section for each major currency, and we also offer a plethora of resources on USD-pairs such as EUR/USD, GBP/USD, USD/JPY, AUD/USD. Traders can also stay up with near-term positioning via our IG Client Sentiment Indicator.
Forex Trading Resources
DailyFX offers a plethora of tools, indicators and resources to help traders. For those looking for trading ideas, our IG Client Sentiment shows the positioning of retail traders with actual live trades and positions. Our trading guides bring our DailyFX Quarterly Forecasts and our Top Trading Opportunities; and our real-time news feed has intra-day interactions from the DailyFX team. And if you’re looking for real-time analysis, our DailyFX Webinars offer numerous sessions each week in which you can see how and why we’re looking at what we’re looking at.
If you’re looking for educational information, our New to FX guide is there to help new(er) traders while our Traits of Successful Traders research is built to help sharpen the skill set by focusing on risk and trade management.
--- Written by James Stanley, Strategist for DailyFX.com
Contact and follow James on Twitter: @JStanleyFX


