


Talking Points:
- The Cable sell-off has continued into another week with the pair now testing six month lows, levels last traded at in mid-December of last year. GBP/USD remains oversold, as it has been on the Daily chart for the entirety of the month of May.
- Last week we looked at bearish continuation, playing lower-high resistance off of a prior area of support. This week presents a more-challenging backdrop, as we’re now testing a deeper support level while the pair remains oversold; but a pullback to the prior area of support around 1.3400 can re-open the door to short-side continuation in GBP/USD.
- Quarterly Forecasts have just been updated, and the Q2 forecast for GBP/USD is available from the DailyFX Trading Guides Page. If you’re looking to improve your trading approach, check out Traits of Successful Traders. And if you’re looking for an introductory primer to the Forex market, check out our New to FX Guide.
Want to see how retail traders are currently trading GBP/USD? Click here for GBP/USD Sentiment.
GBP/USD Sell-Off Continues Down to December Lows
The bearish move in the British Pound has continued into another week. After displaying a semblance of support around the key level of 1.3500 in the first couple of weeks of May, GBP/USD posed a downside break at the start of last week to continue the move, and with a heavy outlay of UK data on the calendar, the potential for a deeper bearish move was there. We looked at short-side setups last week, utilizing resistance around that prior area of support. That setup filled-in on Tuesday, after which GBP/USD continued down to fresh lows, taking out two of our three targets in the process.
At this point, we’ve seen a bit of support show-up in a familiar area. The zone that runs from 1.3269-1.3321 is an area that helped to mark resistance in August, October and November of last year; then becoming support in December before the pair launched up to fresh post-Brexit highs.
GBP/USD Daily Chart: Support Shows Around Six-Month Lows

Chart prepared by James Stanley
At this point, the primary complication with longer-term stances around GBP/USD is just how oversold the move has become. RSI has been in oversold territory for the entire month of May, and while this doesn’t preclude further declines, it does make the prospect of such a bit more distant.
GBP/USD Daily Chart: Oversold While Sitting at Six-Month Lows
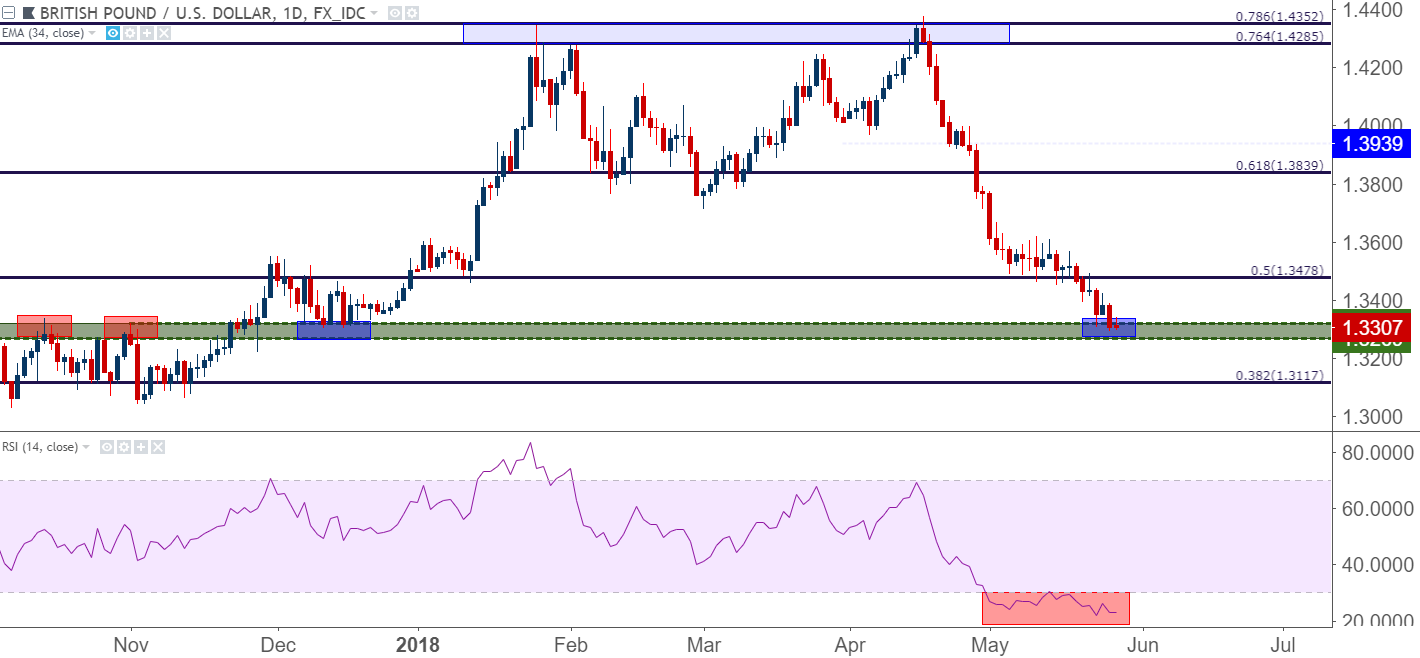
Chart prepared by James Stanley
Moving Forward
With the bearish trend as built-in on the pair as it has been, traders will likely want to continue to move forward with a short-side bias. While a situation of this nature would normally open the possibility of reversals, this is an area where traders will likely want to be very careful. Both themes in the pair have been rather vivid of recent, with a really strong US Dollar showing against most major currencies and a really weak British Pound; so looking for a reversal here is effectively betting on two themes to change or reverse at once. While this is possible, it’s not a high-probability type of scenario.
Instead, traders can look for a pullback in this move to open the door for additional short-side setups, similar to what was looked at last week. This way, risk can be managed so that if a reversal does take place, the loss can be mitigated.
Such an instance can be watched for around the 1.3400-handle. This is an area from where a prior swing-low helped to set swing-high resistance on Thursday of last week, and this is also a level that can open the door for stops go be placed above the 1.3500-zone. If we do see prices pull back to this level while remaining below the 1.3421 high, short-side strategies can be implemented, targeting a re-test of 1.3300 followed by secondary targets at 1.3224 and then 1.3117.
GBP/USD Hourly Chart: Lower-High Resistance Potential Keeps Door Open for Shorts
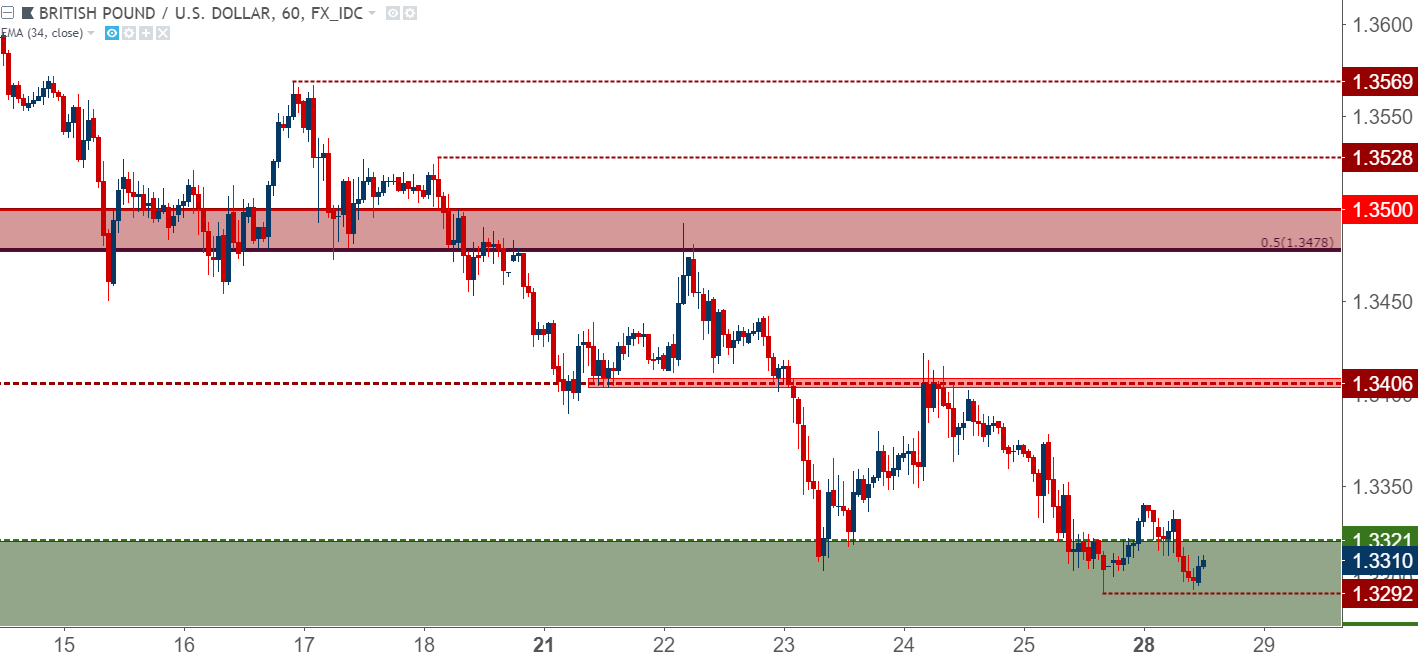
Chart prepared by James Stanley
To read more:
Are you looking for longer-term analysis on the U.S. Dollar? Our DailyFX Forecasts for Q1 have a section for each major currency, and we also offer a plethora of resources on USD-pairs such as EUR/USD, GBP/USD, USD/JPY, AUD/USD. Traders can also stay up with near-term positioning via our IG Client Sentiment Indicator.
Forex Trading Resources
DailyFX offers a plethora of tools, indicators and resources to help traders. For those looking for trading ideas, our IG Client Sentiment shows the positioning of retail traders with actual live trades and positions. Our trading guides bring our DailyFX Quarterly Forecasts and our Top Trading Opportunities; and our real-time news feed has intra-day interactions from the DailyFX team. And if you’re looking for real-time analysis, our DailyFX Webinars offer numerous sessions each week in which you can see how and why we’re looking at what we’re looking at.
If you’re looking for educational information, our New to FX guide is there to help new(er) traders while our Traits of Successful Traders research is built to help sharpen the skill set by focusing on risk and trade management.
--- Written by James Stanley, Strategist for DailyFX.com
Contact and follow James on Twitter: @JStanleyFX


