


Talking Points:
- Strength continues to show in the British Pound as a strong month of March reverses February losses. Last week produced a number of drivers around the British currency, key of which was a hawkish shift at the Bank of England that puts the spotlight on the bank’s May rate decision for the next potential adjustment to interest rates.
- Cable is fast approaching a key zone of resistance that’s been a major hindrance to GBP/USD’s 2018 bullish run. This zone comes-in at the 76.4 and 78.6% retracements of the ‘Brexit move’ in the pair, and bullish momentum appears to be waning as we near this zone with RSI divergence beginning to show.
- Are you looking to improve your trading approach? Check out Traits of Successful Traders. And if you’re looking for an introductory primer to the Forex market, check out our New to FX Guide.
Want to see how retail traders are currently trading GBP/USD? Click here for GBP/USD Sentiment.
GBP/USD Breakout Continues to Fresh Seven-Week Highs
Last week saw a number of interesting items come across the wires in pertinence to the British Pound, but perhaps the most interesting was price action in the currency as the bullish breakout continued on to fresh highs. In GBP/USD, that breakout started two weeks ago, as bulls pushed prices above a descending trend-line that had held the highs since January. As we wrote at the time, a test of 1.4000 appeared likely in the near-term; and after this level was scaled-above on the following Monday, we looked at the prospect of playing higher-low support around the 1.4000 level ahead of UK CPI.
That support came-in as the higher-low on Tuesday, shortly after the release of CPI, and bulls remained in-control for most of last week.
GBP/USD Four-Hour Chart: Bullish Breakout Continues After 1.4000 Support Check

Chart prepared by James Stanley
Imposing Resistance Zone Nears
The British Pound was in the midst of an aggressively bullish trend in January. Buyers began to shy away from the move as the 78.6% Fibonacci retracement of the Brexit move neared, with the high coming-in just a couple of pips shy of that level at 1.4352. A subsequent attempt to take-out that high in January faltered, and we got a lower high at the 76.4% retracement of that same move. This begs the question: Do bulls finally have the ammunition that they need to leave this zone behind once and for all?
GBP/USD Daily Chart: 76.4, 78.6% Levels of Brexit Move Helping to Set Resistance
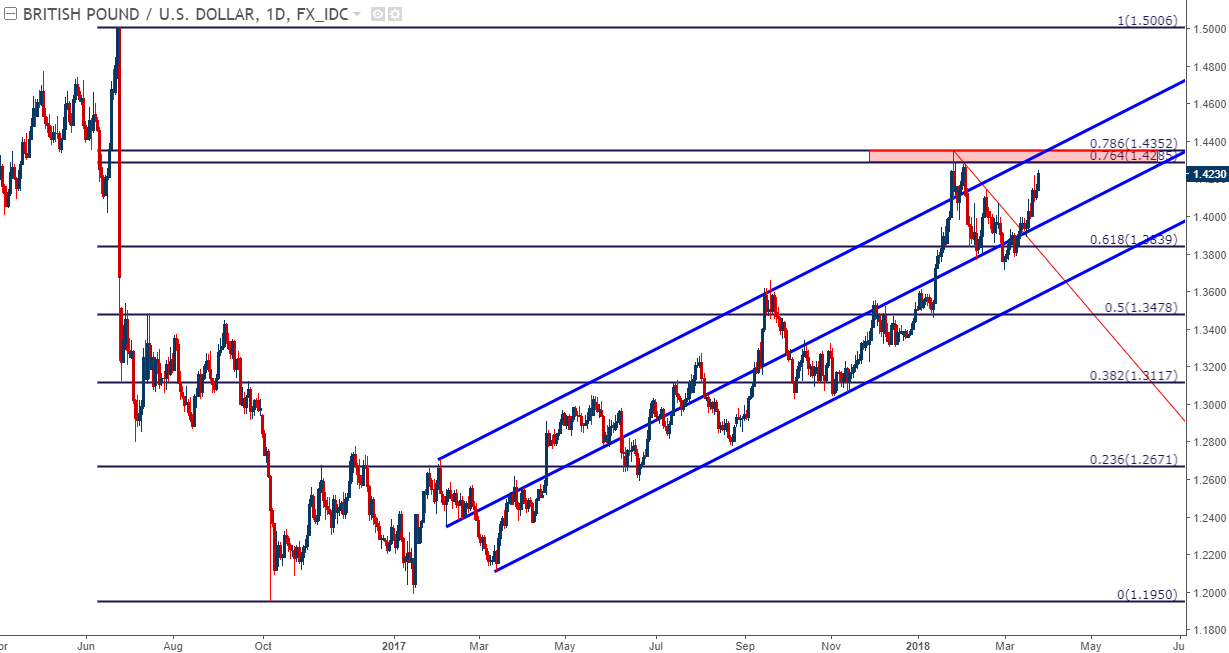
Chart prepared by James Stanley
GBP/USD Near-Term
The complication around GBP/USD at the moment is one of timing. While momentum has been undeniably bullish over the past couple of weeks and, bigger-picture, for most of the month of March, we’re at overbought levels from a number of different vantage points. On the four-hour chart, we’ve already seen RSI divergence starting to show as the indicator remains in overbought territory. The fact that this is showing so near those 2018 highs is another impediment to taking on longer-term bullish exposure at the moment with the current technical backdrop.
GBP/USD Four-Hour Chart: RSI Divergence Begins to Show as Overbought Conditions Remain

Chart prepared by James Stanley
For bullish continuation, traders can look for higher-low support above that prior test of 1.4000. If we break back-below 1.4000, the prospect of bullish continuation will not remain as attractive, and this could be an ideal area to investigate for stop placement on top-side swing strategies. There are three such potential areas of higher-low support above 1.4000, and we’re looking at each on the below hourly chart of GBP/USD.
GBP/USD Hourly Chart: Higher-Low Support Potential For Bullish Continuation Above 1.4000
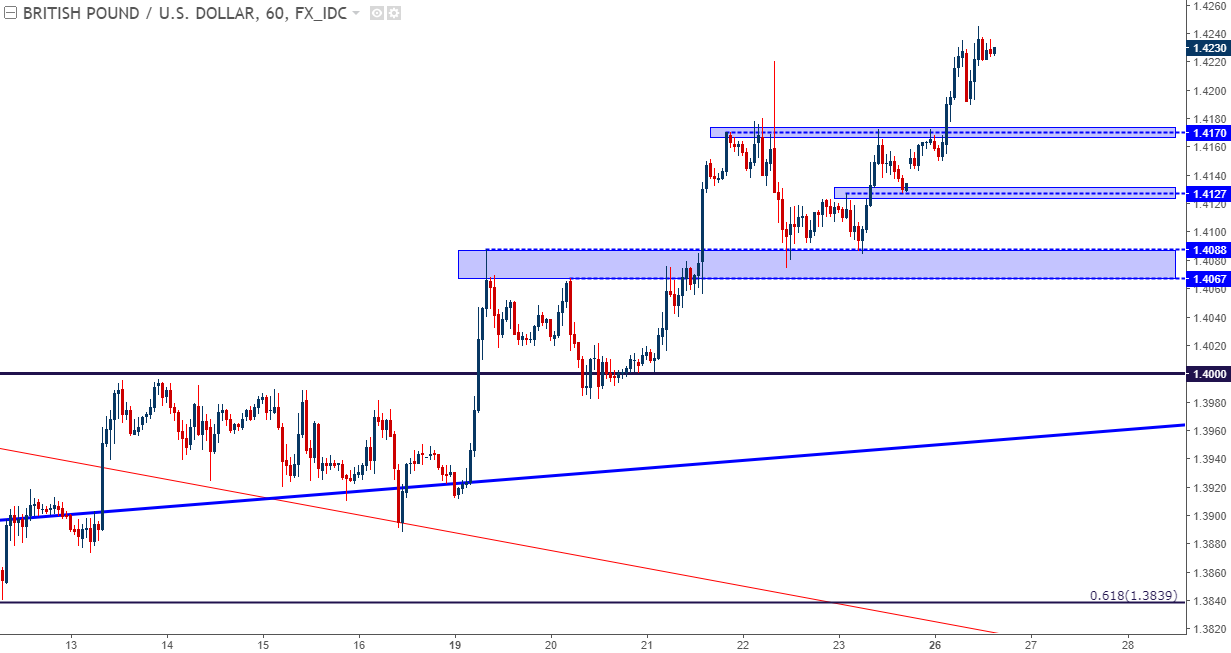
Chart prepared by James Stanley
To read more:
Are you looking for longer-term analysis on GBP/USD? Our DailyFX Forecasts for Q1 have a section specifically for GBP/USD. We also offer a plethora of resources on our GBP/USD page, and traders can stay up with near-term positioning via our IG Client Sentiment Indicator.
--- Written by James Stanley, Strategist for DailyFX.com
To receive James Stanley’s analysis directly via email, please SIGN UP HERE
Contact and follow James on Twitter: @JStanleyFX


