


Talking Points:
- The British Pound remains volatile after yesterday’s 3% inflation print; but a bigger picture direction remains elusive as price action clings to a longer-term support zone.
- Near-term price action in Cable is messy. Below we look at a series of levels that can be utilized in the effort of timing directional strategies in GBP/USD.
- Want to see how GBP and USD are holding up to the DailyFX Forecasts? Click here for full access.
To receive James Stanley’s Analysis directly via email, please sign up here
I n our last article, we looked at GBP/USD re-breaking above a key zone of longer-term support. The area that we were referring to runs from 1.3117 up to 1.3187, with each of those prices derived from longer-term Fibonacci studies. The price of 1.3187 is the 23.6% retracement of the 2014-2016 major move, and a trend-line taken from the highs in each year projects to the September swing-high around 1.3600.
GBP/USD Weekly: Fibonacci Support, Trend-Line Resistance

Chart prepared by James Stanley
The bullish burst that showed up in the British Pound came-in around the BoE’s September rate decision. This is when the bank warned that rate hikes may be on the horizon in the effort of stemming the continued growth in inflation. Shortly after comments from Mr. Mark Carney of the BoE indicated that a hawkish move may be in the cards, GBP/USD ran-up to fresh yearly highs to find resistance around 1.3650. This is where the descending trend-line on the above chart came into play, helping to set near-term resistance as the move digested.
But what initially started as a higher-low support test turned into a bull flag; and then eventually a direct sell-off as prices made a fast approach towards the 1.3000 psychological level. It was around the NFP report on October 6th that a low set-in, and this is when an abysmal NFP print helped to bring USD-weakness back into the fray. In short order, GBP/USD climbed back above the big zone of support/resistance.
GBP/USD Four-Hour: Unable to Hold Support at 50% Retracement, Sell-Off Ensues

Chart prepared by James Stanley
As we walked into this week, a couple of key drivers sat on the calendar for the British Pound. Yesterday brought comments from Mr. Mark Carney as he testified in front of parliament, and this came out around the same time as UK inflation for the month of September. Inflation printed at 3%, which is the highest rate of price increases in the UK since April of 2012. This is also something that would normally bring strength into a currency that’s recently been bid on the basis of tighter policy out of the respective Central Bank. That didn’t happen yesterday, as GBP/USD moved deeper within this support zone as Mr. Carney offered comments throughout the morning.
GBP/USD Hourly: Deeper Dig into Support Zone During Carney Commentary

Chart prepared by James Stanley
The big question, at this point, is whether bulls will return ahead of the BoE’s rate decision in early-November. The bank has exhibited a pattern of making moves around Super Thursday events so that any new actions could be supported with updated forecasts and an accompanying press conference. The date of the next Super Thursday event is November 2nd, and if we don’t get a move at that meeting and the BoE sticks to this pattern, we’ll have to wait until February for the next one.
However, given how messy near-term price action has been, a directional theme is currently unavailable in GBP/USD. Traders would likely want to let price action pick a direction before looking to institute any directional biases. If near-term support does hold in this zone, and if the prior swing-low around 1.3120 remains respected, bullish continuation can be in order. Traders can use a top-side break of the prior swing-high at 1.3338 to denote as such.
On the bearish side, traders would likely want to allow prices to drive below the psychological level of 1.3000 before entertaining any such themes. The prospect of a longer-term run of USD-strength certainly exists, as we outlined earlier this morning; but for traders looking to work with that theme, they’d likely want to allow for proper confirmation before looking to chase the move (USD-higher, GBP/USD-lower).
GBP/USD Four-Hour: Resistance (Blue), Support (Red) Breaks to Open Door for Directional Strategies
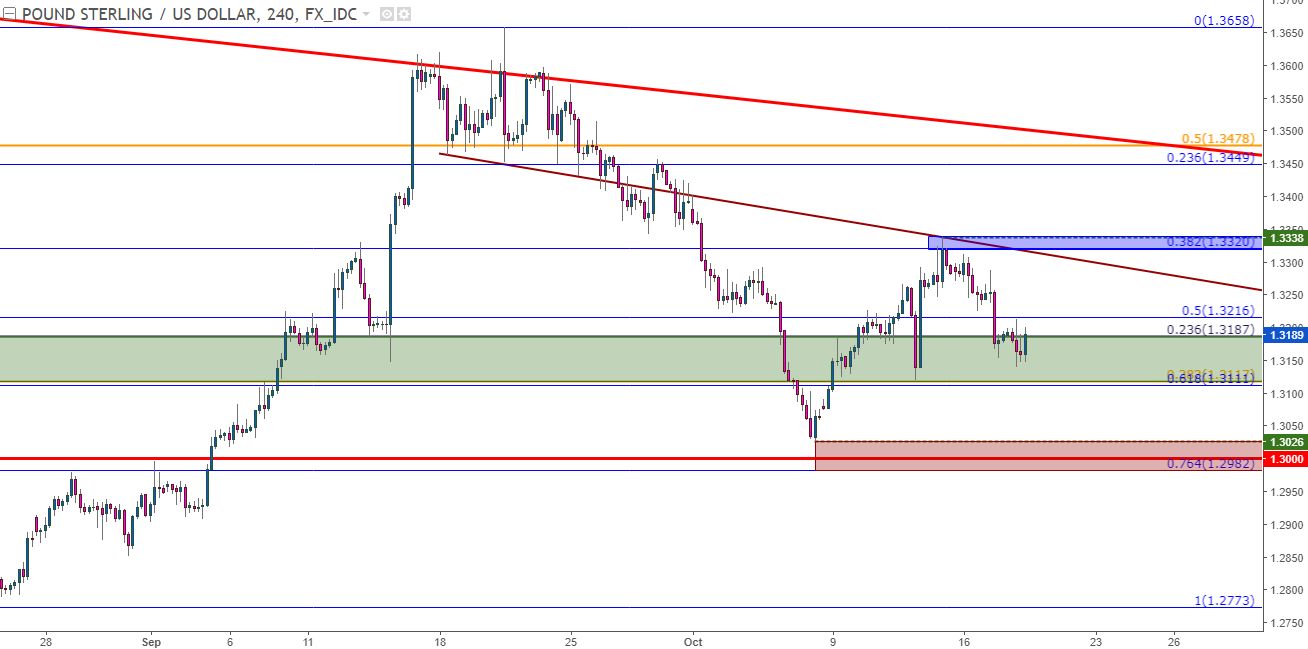
Chart prepared by James Stanley
--- Written by James Stanley, Strategist for DailyFX.com
To receive James Stanley’s analysis directly via email, please SIGN UP HERE
Contact and follow James on Twitter: @JStanleyFX


