


Talking Points:
- Cable continues to retrace a portion of the bullish move that showed in early-September.
- Prices put in a near-50% digestion of the most recent bullish move, and price action remains above a key zone of longer-term support that runs from 1.3117-1.3187.
- The DailyFX Q4 Forecasts were just released for both GBP and USD - Click here for full access.
To receive James Stanley’s Analysis directly via email, please sign up here
In our last article, we looked at the bull flag formation that had built in GBP/USD, highlighting the potential for a deeper retracement. The bullish theme in the British Pound really came to life in early-September when the Bank of England warned that rate hikes may be on the horizon. In short order, GBP/USD shot above 1.3600 after having toiled in the 1.27’s not a month earlier, and we focused-in on an area of support around 1.3478. This is the 50% retracement of the ‘Brexit move’ in the pair, and for a week, this held the lows in Cable.
But as prices started to slide below that Fibonacci level, the bull flag formation presented itself, and this led-into a larger retracement as prices drove down to test deeper support. Please note, the trend channel making up this bull flag formation has been modified since our last article as additional price action has presented itself.
GBP/USD Four-Hour: A Sliding Scale of Support After Breach of 1.3478

Chart prepared by James Stanley
We highlighted two zones of interest in our prior article, derived from a Fibonacci retracement on the most recent bullish move, taking the August low up to the September high. The 38.2% retracement of that move at 1.3321 can be linked with prior price action support around 1.3350 to produce the first of these zones, while the 50% retracement at 1.3217 can be coupled with the psychological level at 1.3250 to help to create the second.
Last week brought a quick test of 1.3350, at which point buyers stepped-in to push prices higher. Price action ran up to the 23.6% retracement until sellers re-entered to push prices down again, and this is what led into that deeper retracement. We’re currently seeing support hold in the second zone that runs from 1.3217-1.3250.
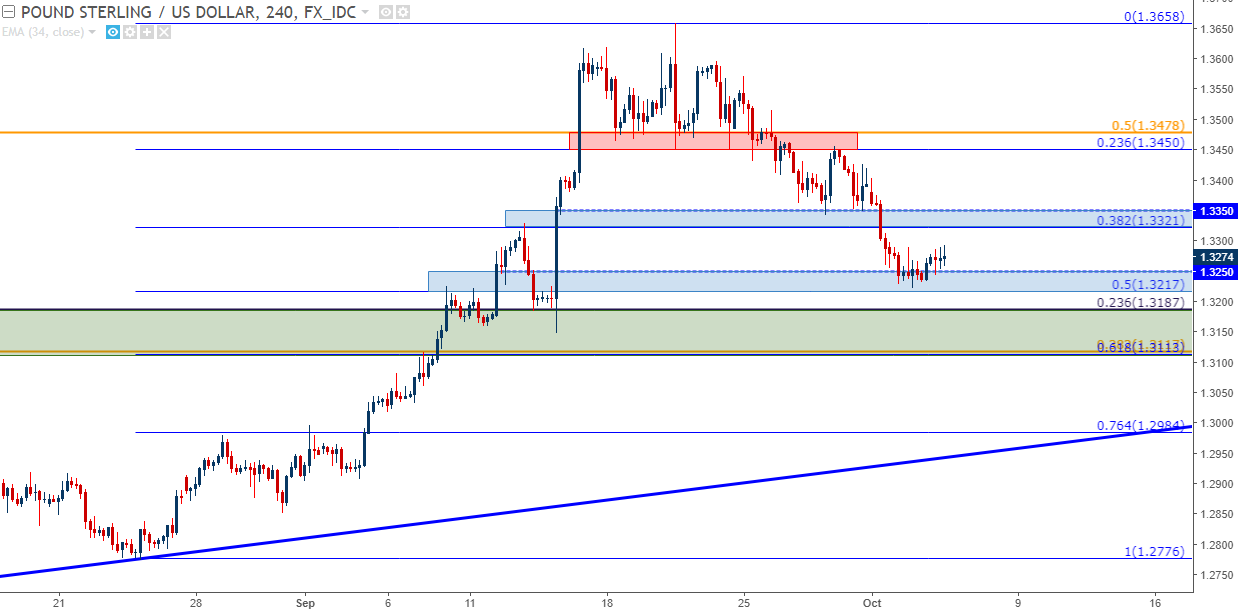
Chart prepared by James Stanley
Continued support in this zone opens the door for bullish setups. Traders can look to lodge stops below the big zone of confluent, long-term support that runs from 1.3117-1.3187. Topside targets could be sought at 1.3400, 1.3478, and then 1.3600. For traders that do want to look for a breakout continuation upon a test of a new high, a fourth target can be incorporated, and kept as open with eyes on the 1.3750 psychological level.
GBP/USD Daily: Prior Points of Resistance as Top-Side Targets; Old Resistance, New Support

Chart prepared by James Stanley
--- Written by James Stanley, Strategist for DailyFX.com
To receive James Stanley’s analysis directly via email, please SIGN UP HERE
Contact and follow James on Twitter: @JStanleyFX


