


Talking Points:
- The British Pound put in an aggressively bullish move around last week’s BoE rate decision, and is seeing a bit of retracement to start this week after a speech from BoE Governor, Mark Carney.
- With the recent bout of GBP strength we’ve seen a rise in retail sellers. I G Client Sentiment sits at -2.46 as of this writing, and given retail trader’s traditional contrarian nature, this is bullish for the pair.
- Want to see how GBP and USD have held up to our DailyFX Forecasts? Click here for full access.
To receive James Stanley’s Analysis directly via email, please sign up here.
In our last article, we looked at higher-low support in GBP/USD after the BoE-fueled bullish breakout. At the BoE rate decision earlier in the month, the bank warned that near-term rate hikes may be on the horizon as inflation remains rather elevated in the U.K. economy. This led to a brisk breakout as Cable broke-out to a fresh one-year high, with resistance finally beginning to set-in around the 1.3600 handle.
Shortly after that bullish breakout, and as we discussed in our previous article, BoE Governor Mark Carney tried to tap the brakes on that theme, as he remarked that any rate hikes would likely be limited and gradual. This dented that bullish move, albeit temporarily, as price action found support at a key level of 1.3478. This is the 50% retracement of the ‘Brexit move’ in the pair, and that support held for most of last week before prices finally started to slide below yesterday.
After numerous tests of that support last week, bears are finally grabbing control of short-term price action and, when the near-term lower-lows are combined with the lower-highs that have started to show-up, this brings on a bull flag formation as we have a short-term descending channel as a retracement in the longer-term bullish move.
GBP/USD Four-Hour: Bull Flag Develops with Lower-Lows, Highs

Chart prepared by James Stanley
This short-term bull flag helps to highlight how shallow the retracement has been thus far, at least in terms of the bullish move that started two weeks ago. At this stage, we’ve retraced less than 30% of that move, and given that bulls have shown little response to these deeper support tests below 1.3478, it would appear as though a deeper retracement may be in the cards.
In our last article, we noted two areas that could be attractive for such a scenario, around 1.3350 and 1.3250. If we apply a Fibonacci retracement to this most recent bullish move, taking the August low up to the September high, we can see where each of those prices falls near a retracement level of relevance. The 38.2% retracement of that move comes-in at 1.3321, and the 50% retracement is at 1.3217. These levels can be incorporated to produce support zones with which traders can follow in the effort of trading the longer-term, bullish continuation theme in GBP/USD.
GBP/USD Hourly: Short-Term Fibonacci Retracement Applied, Emphasis on 38.2%, 50% Levels
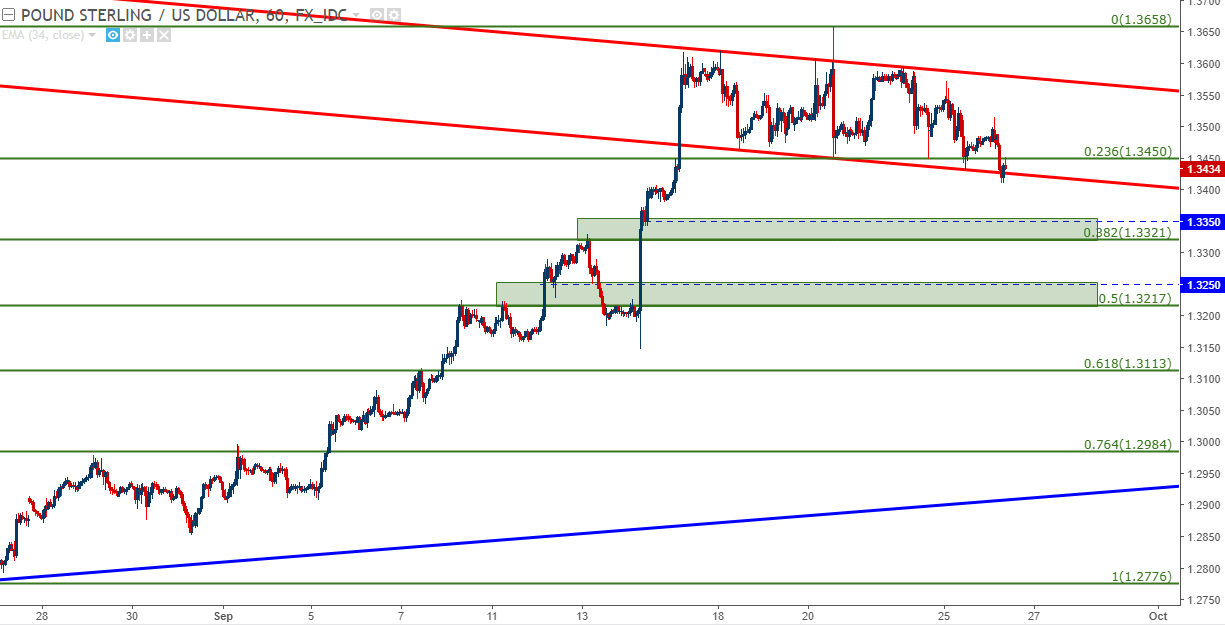
Chart prepared by James Stanley
For stop placement and directional cues, the longer-term, confluent zone that runs from 1.3117-1.3187 could be attractive. If price action is unable to hold above this zone, then the bullish theme in GBP/USD will no longer be attractive, and a break-below can open the door to short-side exposure. But, until that happens, this could be a usable area to look to for stop placement if support shows in either of the above zones.
GBP/USD Daily: Longer-Term Support Zone 1.3117-1.3187 Highlighted

Chart prepared by James Stanley
--- Written by James Stanley, Strategist for DailyFX.com
To receive James Stanley’s analysis directly via email, please SIGN UP HERE
Contact and follow James on Twitter: @JStanleyFX


