


Talking Points:
- GBP/USD Technical Strategy: Holding confluence of support keeps market’s attention
- SSI is currently 1.3165 on GBP/USD as 56% of retail traders are currently long. To stay up with the Speculative Sentiment Index, please click here.
- BoE policymaker Forbes’s comments on wage and price growth picking up faster than expected
- If you’re looking for trading ideas, check out our Trading Guides
Cable is holding above the 100-DMA and shows multiple signs of life for the Bulls as the USD continues its descent toward new 2017 lows. The stability above the Ichimoku Cloud provides credibility to those who bought GBP/USD after PM Theresa May spelled out the U.K.’s plan for Brexit last month. Naturally, the question has turned to the sustainability of the nearly ~5% move off the 2017 low.
The market still anticipates the triggering of article 50 by the end of March. Despite Tuesday’s move to a two-week low at 1.23460 (50% of the Mid-January to early February move,) there is still hope for further upside based on the continual re-coupling of the extreme bearish sentiment, which is currently at 25% on the DSI as of Tuesday’s close. Given that the USD currently sits at 70% on Jake Bernstein’s futures sentiment index for Dollar futures and Sterling futures, there is still upside potential based on a reversion to the mean of extreme sentiment.
Interested in Joining Our Analysts, Instructors, or Strategists For a Free Webinar? Register Here
While Sterling still has its fundamental challenges, as does the US, but we can utilize recent pivots on the price charts to help us build a bias going forward. Tuesday’s two-week low and 50% retracement move aligns with the Daily Ichimoku Cloud that looks to be rebounding as RSI(5) on the daily chart moves higher off a rising Trendline.
There remains clear resistance at 1.27/28 as you can see on the chart with the December closing high and early February high of 1.2706. In addition to the rising RSI(5), and apparent support of the Ichimoku cloud and 50% Fibonacci retracement, it’s worth keeping an eye on Andrew’s Pitchfork that is drawn on the chart below.
The AP is drawn off the closing low where there was a momentum spike alongside the price pivots in December and January. The important takeaway of the AP is the rising slope of the median line, which turns our focus toward resistance, which sits near 1.28, and a further break higher could turn focus toward 1.30. Currently, SSI is standing in the way of this extension higher from a contrarian indicator perspective. A move to negative SSI would favor a move higher along with what is seen on the daily chart.
What Did The Analysts Learn After Trading Of All 2016? Click Here To Find Out
D1 GBPUSD/ Chart: Holding Above Ichimoku Cloud And Moving Toward Top Half of AP
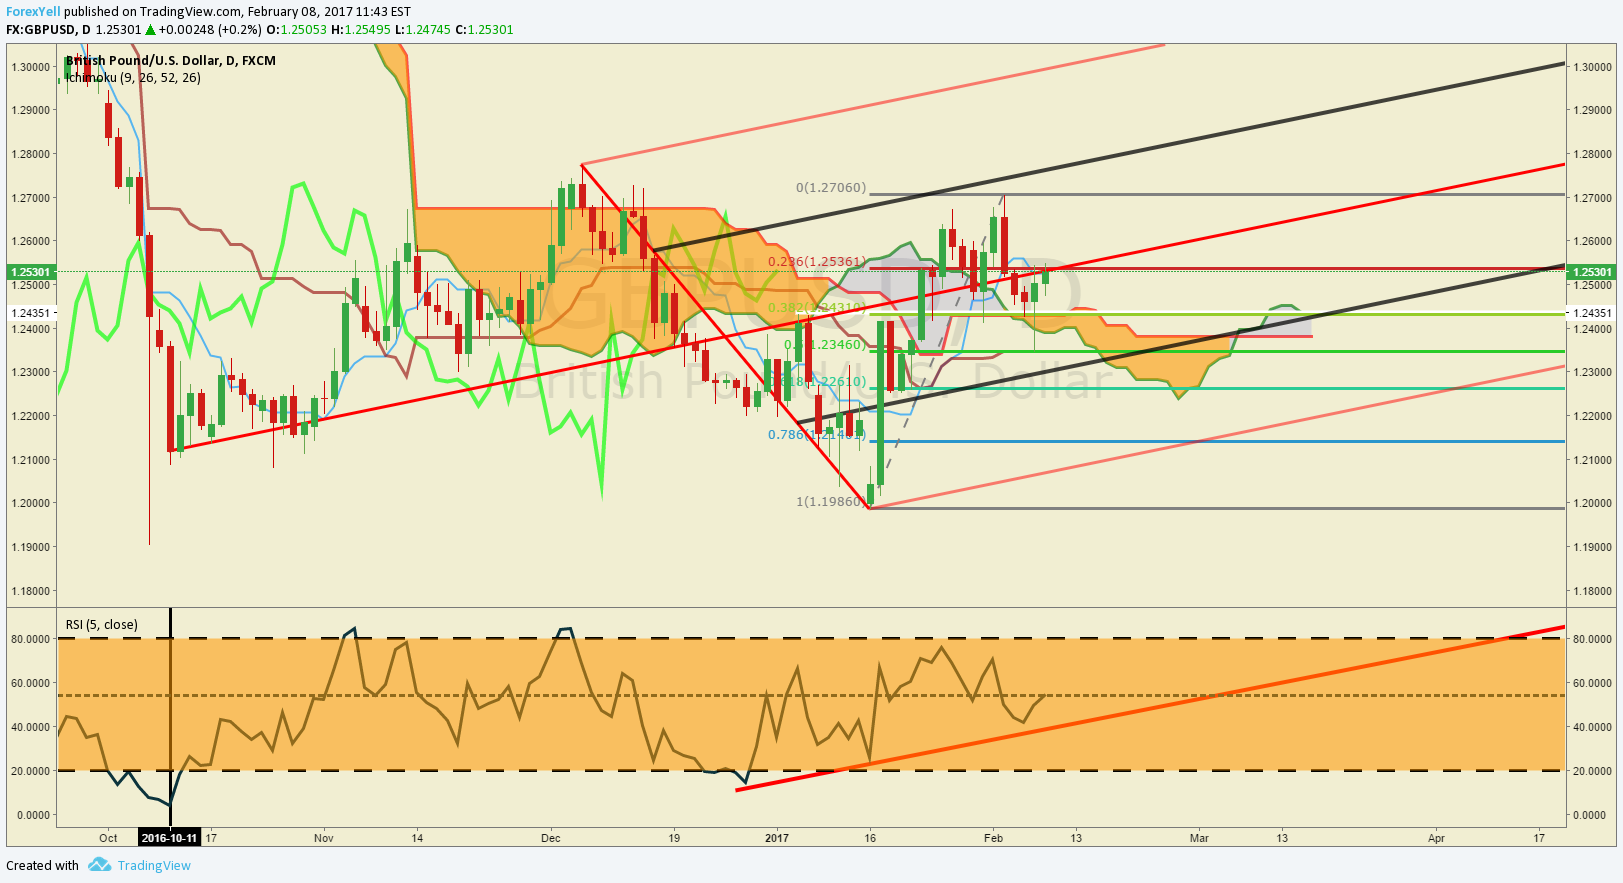
Chart Created by Tyler Yell, CMT
---
Key Short-Term Levels as of Tuesday, February 8, 2017
For those interested in shorter-term levels of focus than the ones above, these levels signal important potential pivot levels over the next 48-hours.

T.Y.


