


To receive James Stanley’s Analysis directly via email, please sign up here.
Talking Points:
- GBP/USD Technical Strategy: Longer-term bearish, near-term price action trading in tighter range with recent compression of price action.
- While many are still actively looking to sell on the brute uncertainty posed by the Brexit-referendum, the dramatic drop in Sterling prices is likely going to prelude an increase in inflationary pressures. This may force the BoE’s hand away from future rate cuts.
- SSI - If you’re looking for trading ideas, check out our Trading Guides. And if you want something more short-term in nature, check out our SSI indicator.
In our last article, we looked at a recent uptick of bullish price action in GBP/USD; at least in-part driven by higher than expected inflation that had begun to show in the U.K. economy. And this made sense: We were all warned of such a situation by BOE Governor Mr. Mark Carney, who months ahead of the referendum noted that a decision to leave the European Union could entail a ‘sharp re-pricing’ in the value of the British Pound, and this could produce higher inflation; all the while coupled with rising unemployment and slowing growth: Pretty much a cornocoppia of pain for a Central Banker. At that point they have to decide whether they want to a) hike rates to stem inflationary pressure at the behest of employment and growth, or b) cut rates at the risk of running even higher levels of inflation which can, of course, begin to choke growth even further, spurn higher levels of unemployment, etc.
The irony of the situation is that, at least at this point, it appears that Mr. Carney’s responsive actions may be driving these risks more than the actual Brexit referendum itself. In the days following the Brexit referendum, Sterling price action was recovering and heading higher. That is, until Mr. Carney called an impromptu press conference to warn that rate cuts were coming. In the days following those warnings, the British Pound drove to even-lower 30-year lows to set price action support at a a level that has yet to be eclipsed. Since then, price action in GBP/USD has been winding deeper into a congestion pattern.
Even the ‘bazooka’ of stimulus launched by the Bank of England in early August failed to set a fresh low; and when price action fails to set a ‘lower-low’ on such an announcement that should elicit extreme bearishness, that’s a sign that a market may still be significantly oversold. And if we combine that with the fact that inflationary pressure is beginning to show, as led by import prices in response to the recent ‘sharp re-pricing’ in the British Pound, this could further the expectation for a bullish backdrop for the currency; as rising inflationary pressure could prevent the BOE from posing any near-term rate cuts.
On the chart below, we’re looking at post-Brexit price action in GBP/USD as prices continues to compress after the ‘post-Brexit’ low was set at 1.2788.
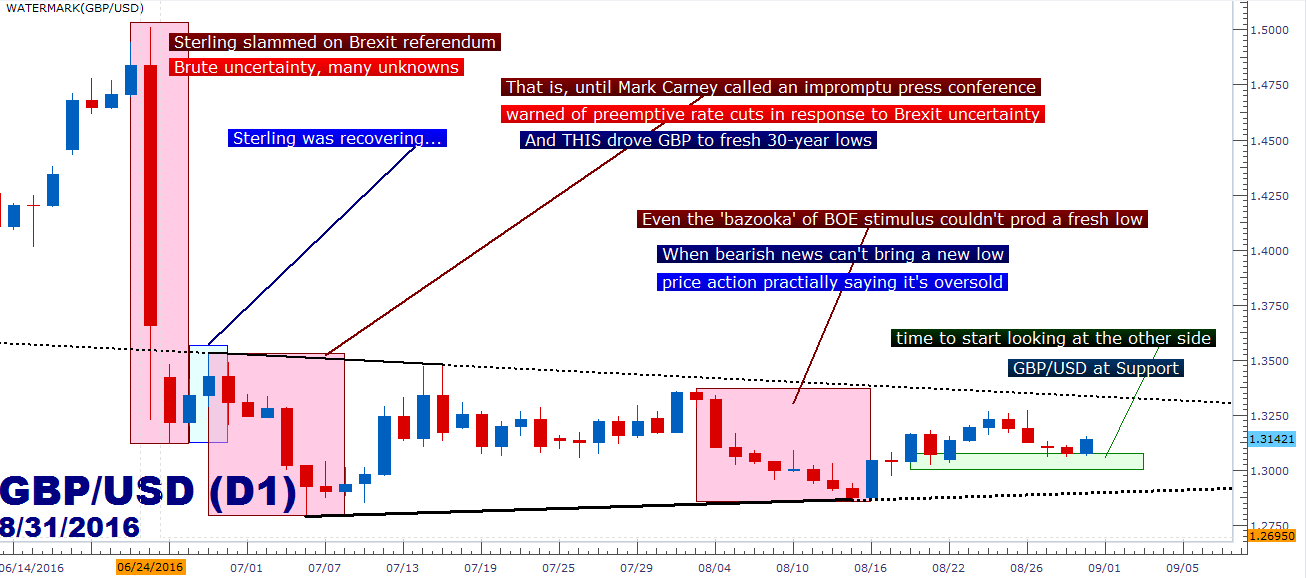
Chart prepared by James Stanley
For traders looking to establish bullish positions in the British Pound, there is but one near-term complication, and that’s rampant US Dollar strength since last Friday. The Dollar is running higher on more hawkish rate hike expectations from the Federal Reserve, but if recent history is any guide, this theme is unlikely to last.
Traders can follow price action in order to act on this theme. For GBP/USD, traders would likely want to wait for a top-side break of the wedge-like formation that’s been building, and this is the same ‘litmus’ level we looked at in our last article, around the prior price action swing at 1.3357. Should price action break above 1.3357, traders can then look to buy the ‘higher-low’ which may show in the zone around the price of 1.3250 (prior price action resistance as well as being a key psychological level).

Chart prepared by James Stanley
--- Written by James Stanley, Analyst for DailyFX.com
To receive James Stanley’s analysis directly via email, please SIGN UP HERE
Contact and follow James on Twitter: @JStanleyFX


