


To receive Tyler’s analysis directly via email, please SIGN UP HERE
Talking Points:
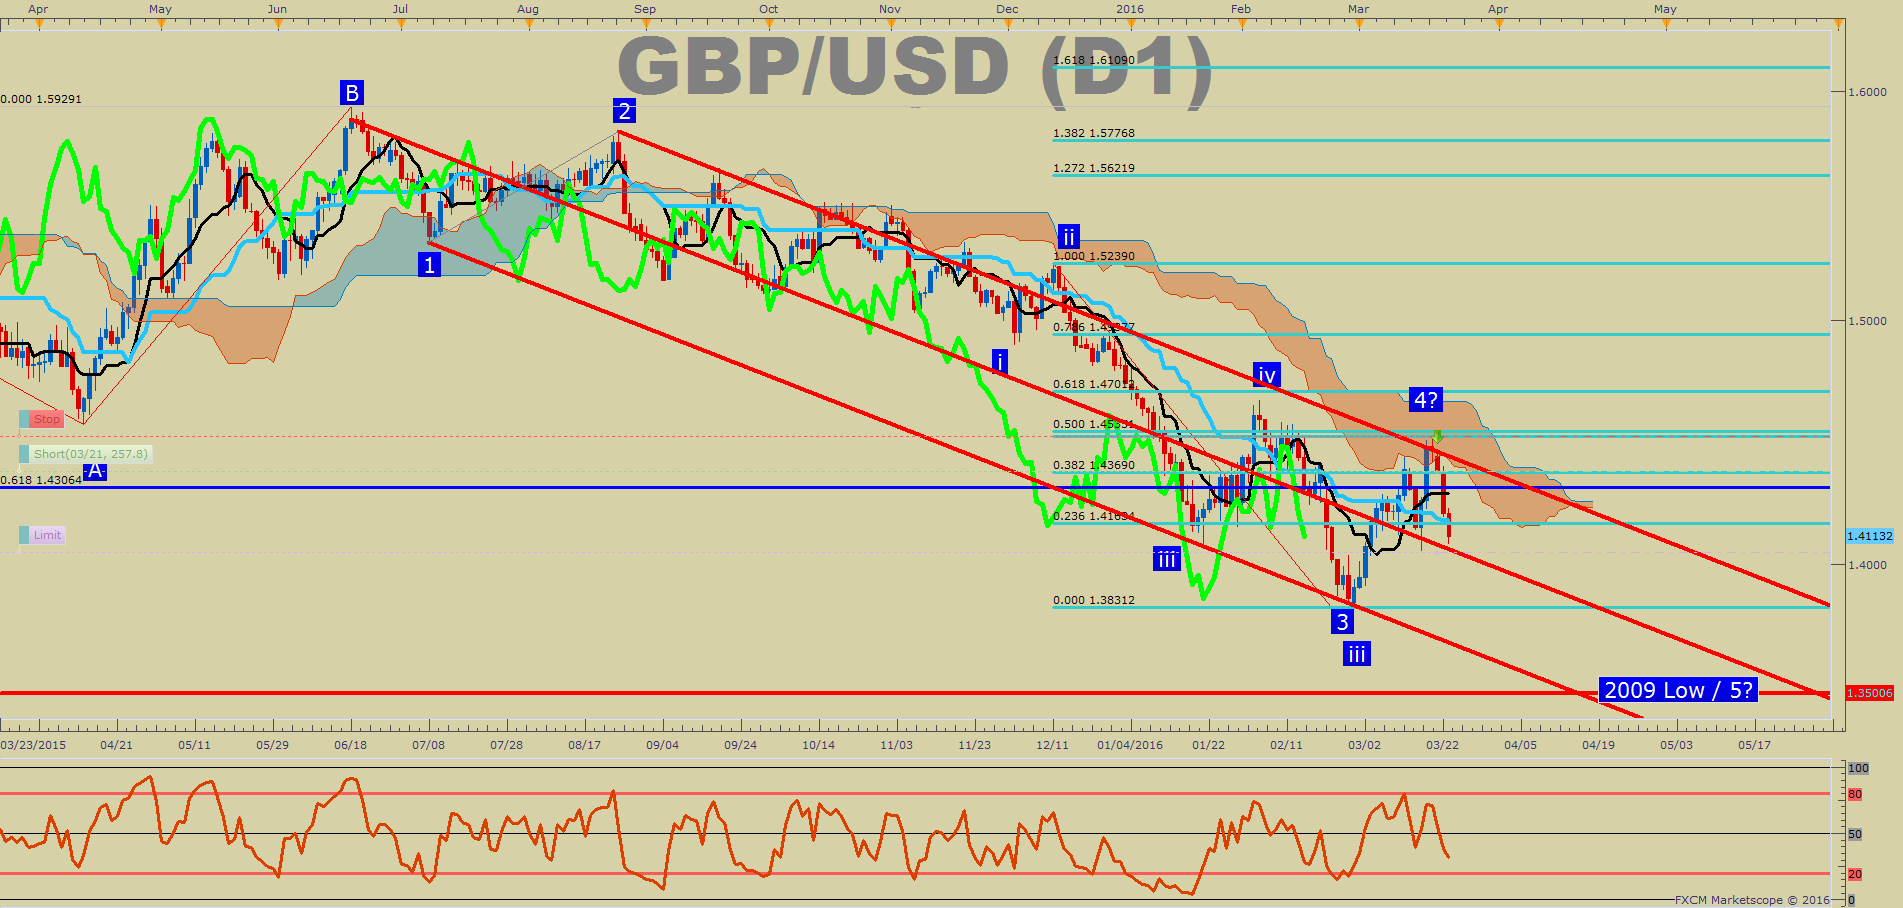
- GBP/USD Technical Strategy : Short From 1.4515 Resistance, Watching 1.4050 Target
- GBP Weakness Extending as Brexit Gets Priced In
- Sentimental Trading System Warns of Further Losses
Today is a special day for those who follow implied volatility. Specifically, the GBPUSD 3M ATM implied volatility is now pricing in the date of the British referendum. Implied volatility is the estimated volatility of a market or in this case, the currency pair’s price. In general, implied volatility increases when the market is bearish, and the rise in implied volatility for GBP/USD has reached its highest level since 2011 today and may continue to rise alongside the fears of a ‘Brexit’ coming to fruition.
You can read much of what you need to know about the ‘Brexit’ vote on June 23 here.
While the price of cable has fallen for the fourth straight day, little is encouraging us to ‘buy low.’ We continue to see bearish breakouts alongside a move higher in SSI, our contrarian sentiment trading system. Additionally, the recent move higher ran out of steam against multiple forms of resistance such as the Ichimoku Cloud, Andrew’s Pitchfork, and Fibonacci retracement level resistance. Adding to these factors has been a recent resurgence in the US Dollar index.
GBP/USD Moved Lower From a Confluence of Chart Resistance
To See How FXCM’s Live Clients Are Positioned In FX & Equities Click Here Now.
Key Chart Levels from Here
Since Monday afternoon, the price of Cable has fallen over 250 pips. We have yet to break below the March 16 low of 1.4051 so for now; that is the focus. A break below 1.4051 turns attention towards the February low around 1.3834. For now, resistance will be based on retracement’s level and a move higher towards 1.4220/45; the March 17 low & 38.2% retracement level of the recent move lower may be an attractive zone for reentering a short trade.
Longer term, bearishness will be favored below the 100-day moving average at 1.4634 and the recent lower high at 1.4515. A break above these levels will turn focus to the US Dollar to see if support is breaking their as well. Only in a scenario where the dollar is falling in these resistance levels have broken would buy trade ideas be entertained. For now, a ‘Brexit' poses too much risk and downside shock potential.
Contrarian System Warns of More Downside
In addition to the overall downtrend and as if the recent drop was not enough in light of heightened ‘Brexit’ risk, SSI encourages focus to the downside. Another push lower would align with our Speculative Sentiment Index or SSI. Our internal readings of GBP/USD show an SSI reading at 2.09 as 68% of traders are long. We use our SSI as a contrarian indicator to price action, and the fact that the majority of traders are long and increasingly so gives a signal that Cable may continue moving lower. Interest is increasing as well to the tune of 8.4% higher than yesterday and 4.5% above the monthly average so volatility could continue as well. If the reading were to flip negative, and the price breaks above the resistance mentioned, then we start to look higher. Until then, may the trend continue.
T.Y.


