


To receive James Stanley’s analysis directly via email, please SIGN UP HERE
Talking Points:
- GBP/USD Technical Strategy: Flat, short & long setups identified
- The Cable spent much of last week retracing in the previously triggered down-trend. A Doji on Friday opens the door for near-term swing strategies to the downside.
- Three days of support on a critical Fibonacci level could also present long setups with extremely tight stops to look for continued strength into deeper resistance values.
In our last article, we looked at the precipitous fall in the British Pound after a dovish Bank of England lowered inflation forecasts at Super Thursday, followed by a Blowout NFP report that made a December rate hike out of the Federal Reserve look all but certain. Combined, the impact of these two days’ worth of data contributed to a 350-pip movement lower in GBP/USD, and as we advised in our previous piece, traders looking to jump on the short position would likely want to wait for a cleaner setup before jumping in the market. As we advised, traders can utilize ‘inside’ or ‘outside’ price action to do so; waiting for prices to either break lower (outside price action for a downtrend) or retrace higher (inside price action for downtrends) before looking to trigger the entry.
Well, we spent most of last week watching the Cable retrace higher, and Friday printed a Doji formation that will often show up at the top or bottom of a swing and this may be opening the door for short-side continuation strategies with the potential for attractive stop values. And with UK inflation on tap for Tuesday morning (November 17th), traders may be sitting in front of the next big driver of GBP-moves, as inflation has been a sticky point of contention for the Bank of England looking at the prospect of ‘normalizing policy.’
The short-side setup could be managed with an aggressive stop placed above the Friday high, which also intersected with a key psychological level at 1.5250. Traders can look to place stops a few pips above the high in the ~1.5270 region to take on ~60 pips of risk from current market prices at the time of this writing. For those that want to treat the setup a little more conservatively, we have another key Fibonacci level at 1.5308, and traders can look to lodge wider stops above this threshold to take on ~100 pips of risk.
On the target side for short-positions, 1.5106 becomes a level of interest, as this was the September low, followed by 1.5043 (the NFP Friday low). After that, we have 1.5000 as a major psychological level, and then 1.4910, which is the 61.8% retracement of the ‘secondary move’ in the pair, taking the Financial Collapse low to the 2014 high.
Alternatively, long setups could be sought under the premise that three consecutive days of support coming in at 1.5184 may be proffering something ‘bigger picture’ in the pair. This could be especially attractive for those looking to sell USD, as this is one of the few currencies in the world that’s posed any element of strength against the greenback over the past three trading days. The logic of this setup would need relatively tight stops, given that it’s counter-trend and the bigger-picture downward sloping channel denotes downtrend continuation. But traders can look to wedge stops below the low on Thursday of last week at approximately 1.5170, taking on approximately ~40 pips of risk. This can open the door for an initial target at the 1.5260 level to get a better than 1-to-1 risk-to-reward ratio. After that 1.5284 becomes interesting as this is the projection of the resistance portion of that downward sloping channel (shown in red on the below chart), followed by 1.5308, which is the 23.6% retracement of the ‘big picture’ move in GBP/USD, taking the 2007 high to the Financial Collapse low.
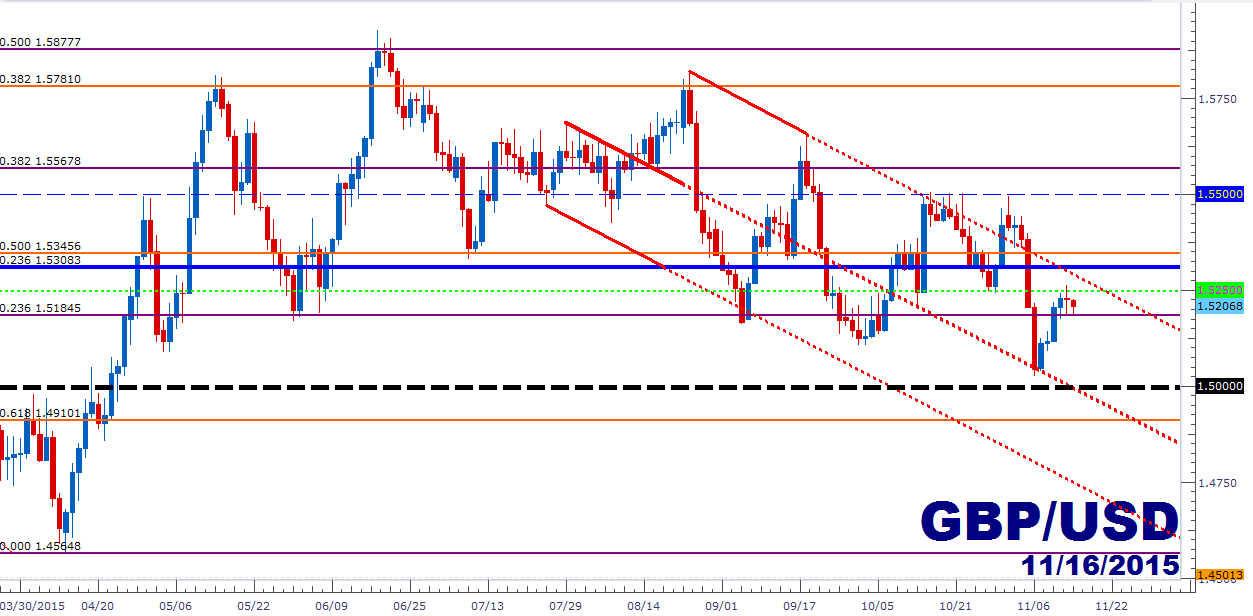
Created with Marketscope/Trading Station II; prepared by James Stanley
--- Written by James Stanley, Analyst for DailyFX.com
To receive James Stanley’s analysis directly via email, please SIGN UP HERE
Contact and follow James on Twitter: @JStanleyFX


