


To receive Ilya's analysis directly via email, please SIGN UP HERE
Talking Points:
- GBP/USD Technical Strategy: Flat
- Support: 1.5430, 1.5194, 1.4811
- Resistance: 1.5699, 1.5814, 1.5966
The British Pound paused to digest losses after producing the largest daily decline in three weeks against the US Dollar. Near-term support is at 1.5430, the 14.6% Fibonacci expansion, with a break below that on a daily closing basis exposing the 23.6% level at 1.5194. Alternatively, a turn back above the May 21 high at 1.5699 opens the door for a challenge of the May 14 top at 1.5814.
Risk/reward considerations argue against entering short with prices in close proximity to support. On the other hand, the absence of a defined bullish reversal signal suggests taking up the long side is premature. We will remain flat for now, waiting for an actionable opportunity to present itself.
Add these technical levels directly to your charts with our Support/Resistance Wizard app!
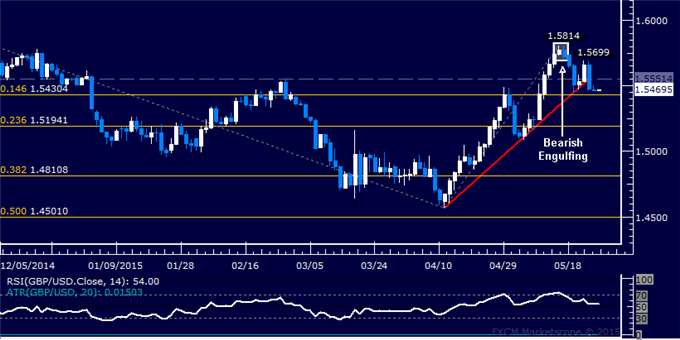
Daily Chart - Created Using FXCM Marketscope
--- Written by Ilya Spivak, Currency Strategist for DailyFX.com


