


To receive Ilya's analysis directly via email, please SIGN UP HERE
Talking Points:
- GBP/USD Technical Strategy: Flat
- Support: 1.5175, 1.5058, 1.4942
- Resistance: 1.5319, 1.5551, 1.5683
The British Pound continues its expected recovery against the US Dollar, with prices issuing the largest daily advance in over a month. Near-term resistance is at 1.5319, the 76.4% Fibonacci retracement, with a break above that on a daily closing basis exposing the February 26 high at 1.5551. Alternatively, a move below the 61.8% level at 1.5175 opens the door for a challenge of the 50% Fib at 1.5058.
We continue to see the longer-term GBPUSD trend as favoring the downside. With that in mind, we will look to further gains as corrective and look for the upswing to run out of steam to position for a selling opportunity.
Add these technical levels directly to your charts with our Support/Resistance Wizard app!
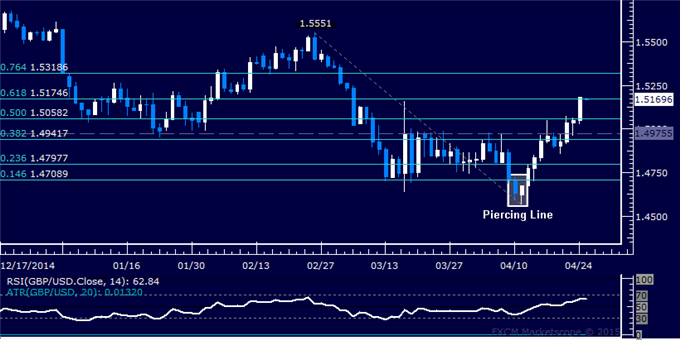
Daily Chart - Created Using FXCM Marketscope
--- Written by Ilya Spivak, Currency Strategist for DailyFX.com


