


Japanese Yen Technical Analysis, AUD/JPY, CAD/JPY, GBP/JPY – Talking Points:
- AUD/JPY constructively positioned above key support.
- CAD/JPY continues to carve out long-term Ascending Triangle pattern.
- Head and Shoulders top hints at further downside for GBP/JPY.
The Japanese Yen has clawed back lost ground against its major counterparts in recent days and looks set to continue pushing higher against the British Pound. However, the higher-beta Australian and Canadian Dollars may outperform the haven-associated JPY, as both currency pairs hover above key support levels.
AUD/JPY Daily Chart – Perched Atop Key Support
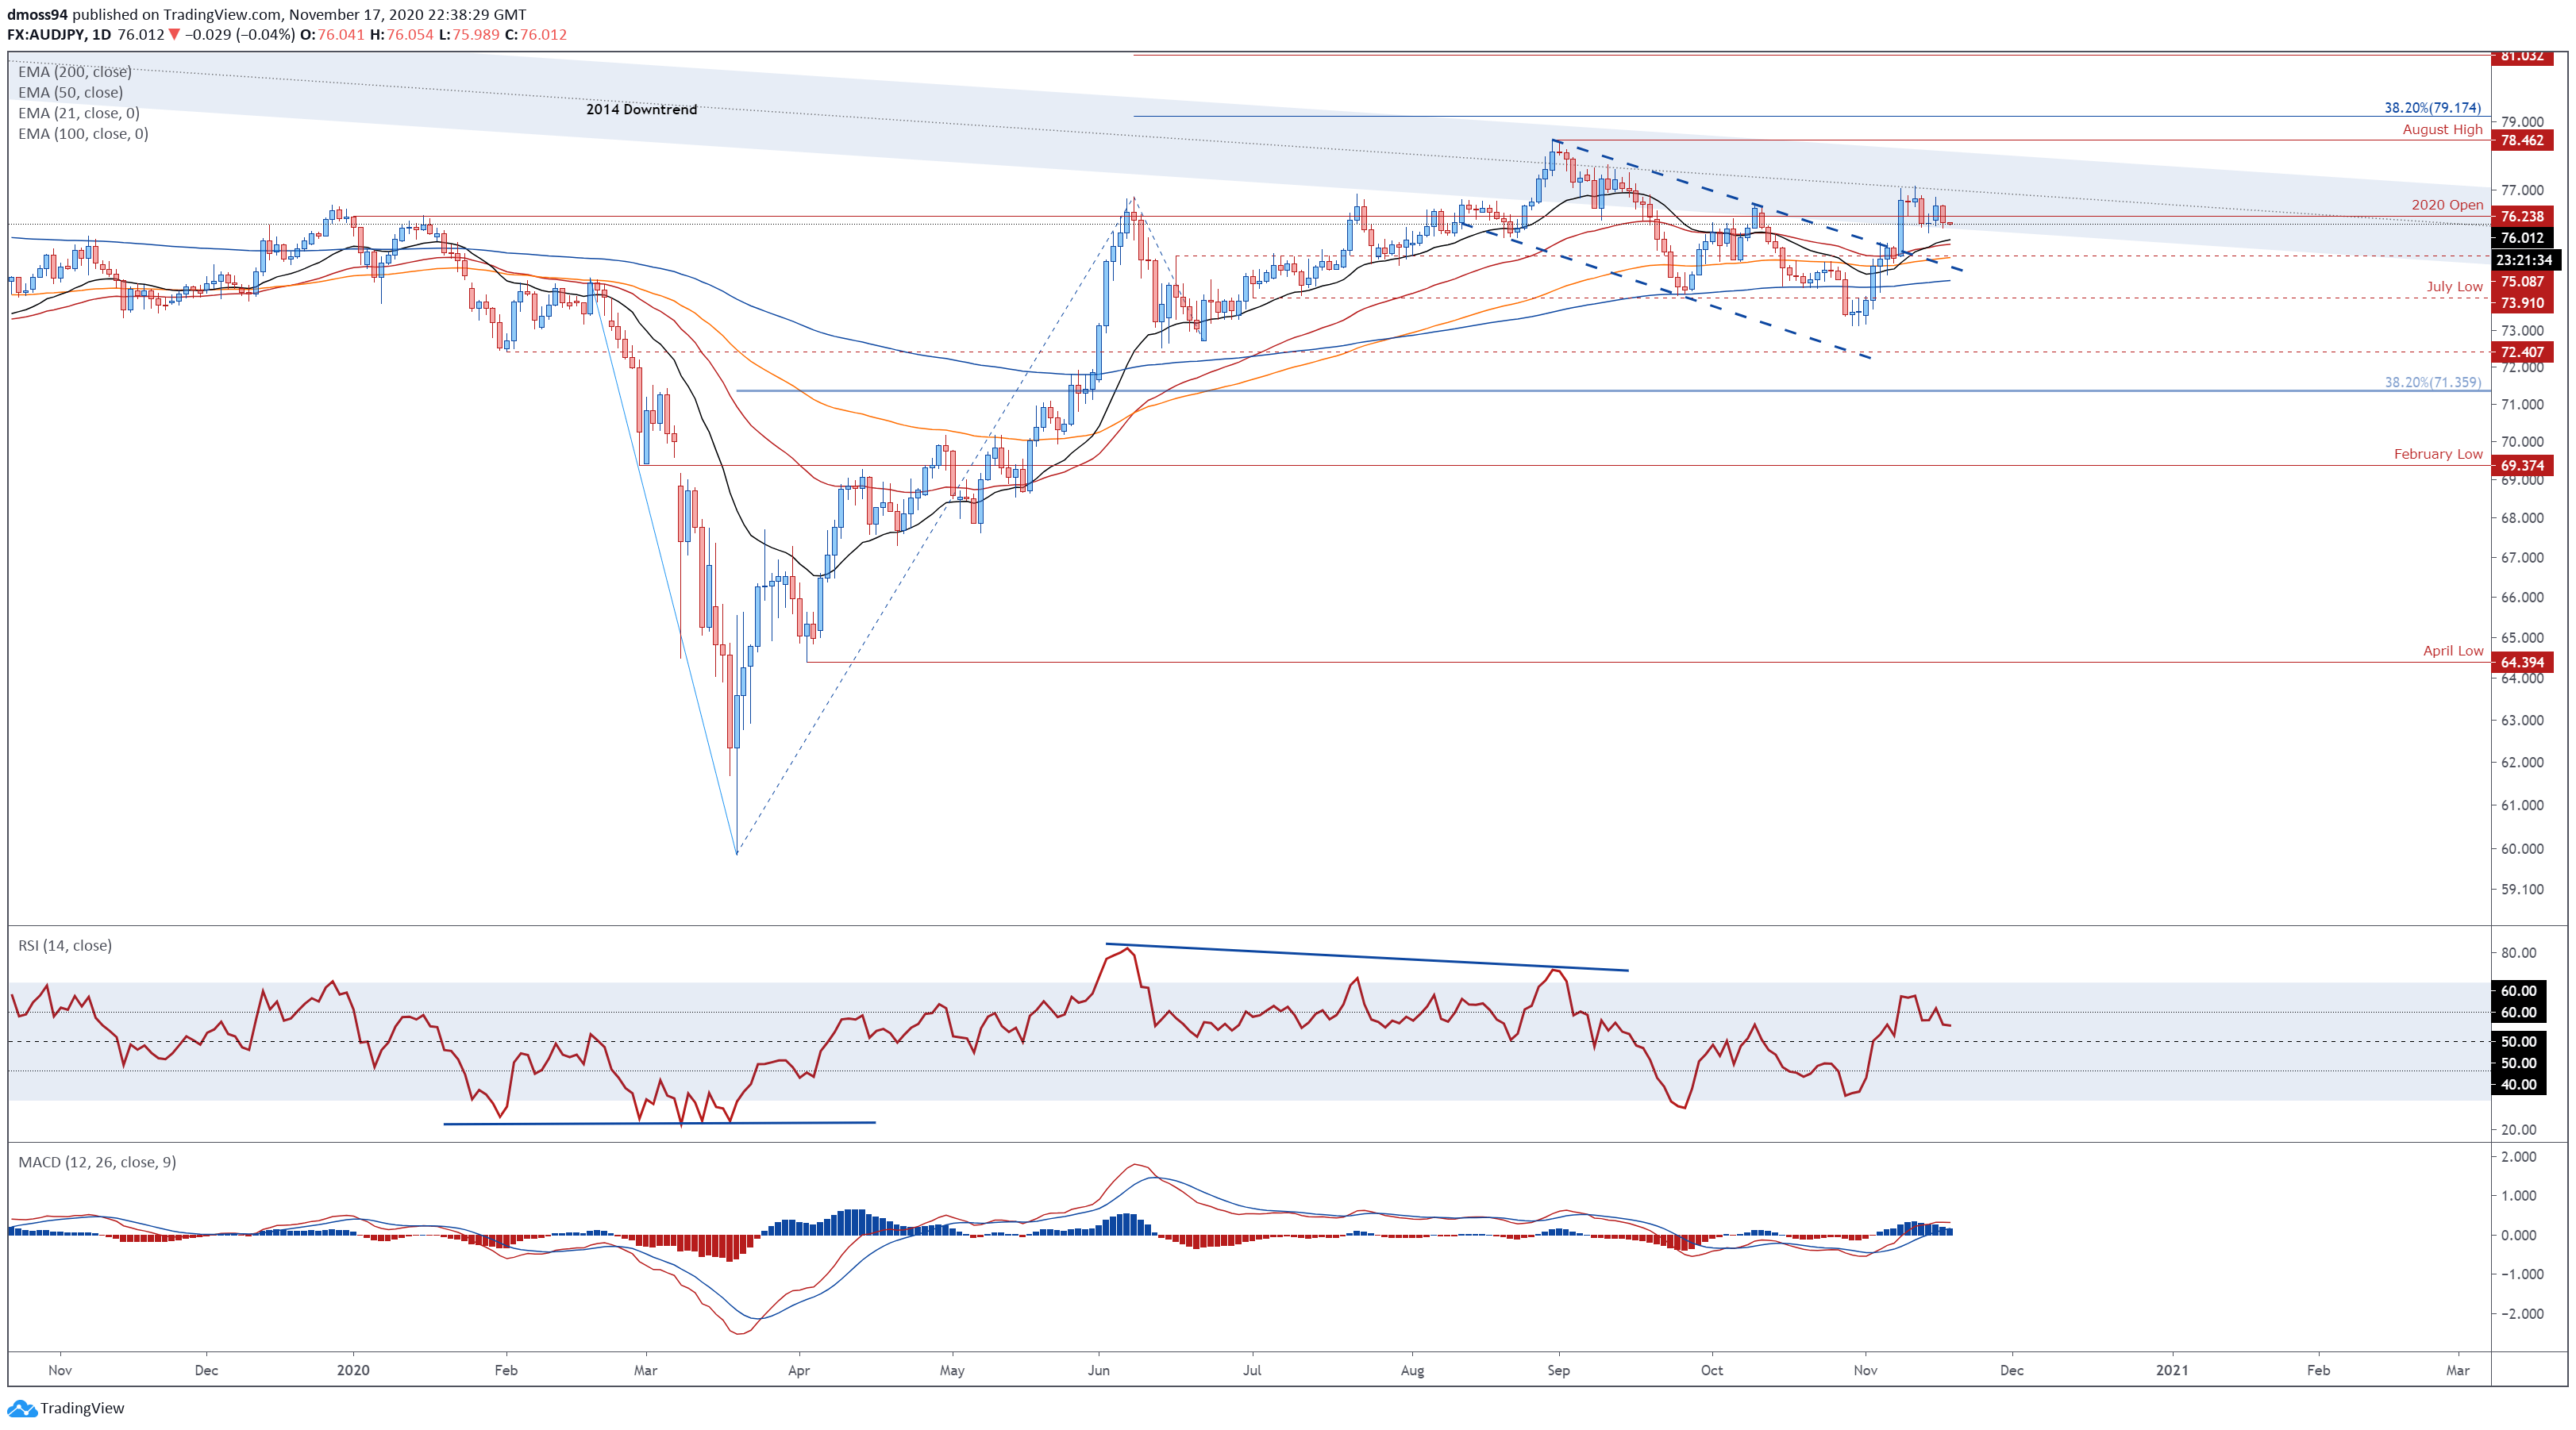
AUD/JPY daily chart created using TradingView
AUD/JPY rates appear to be gearing up for an extended topside push, as prices remain constructively perched above the November 13 low (75.76) and all four moving averages.
With the MACD indicator and RSI both tracking firmly above their respective neutral midpoints, the path of least resistance seems to favour the upside.
Extending upwards from here brings resistance at the monthly high (77.09) into focus, with a daily close above needed to open the door to probe the yearly high (78.46).
Alternatively, a daily close below the 21-DMA (75.56) would probably neutralize near-term buying pressure and generate a pullback towards mobile support at the 100-DMA (75.05).
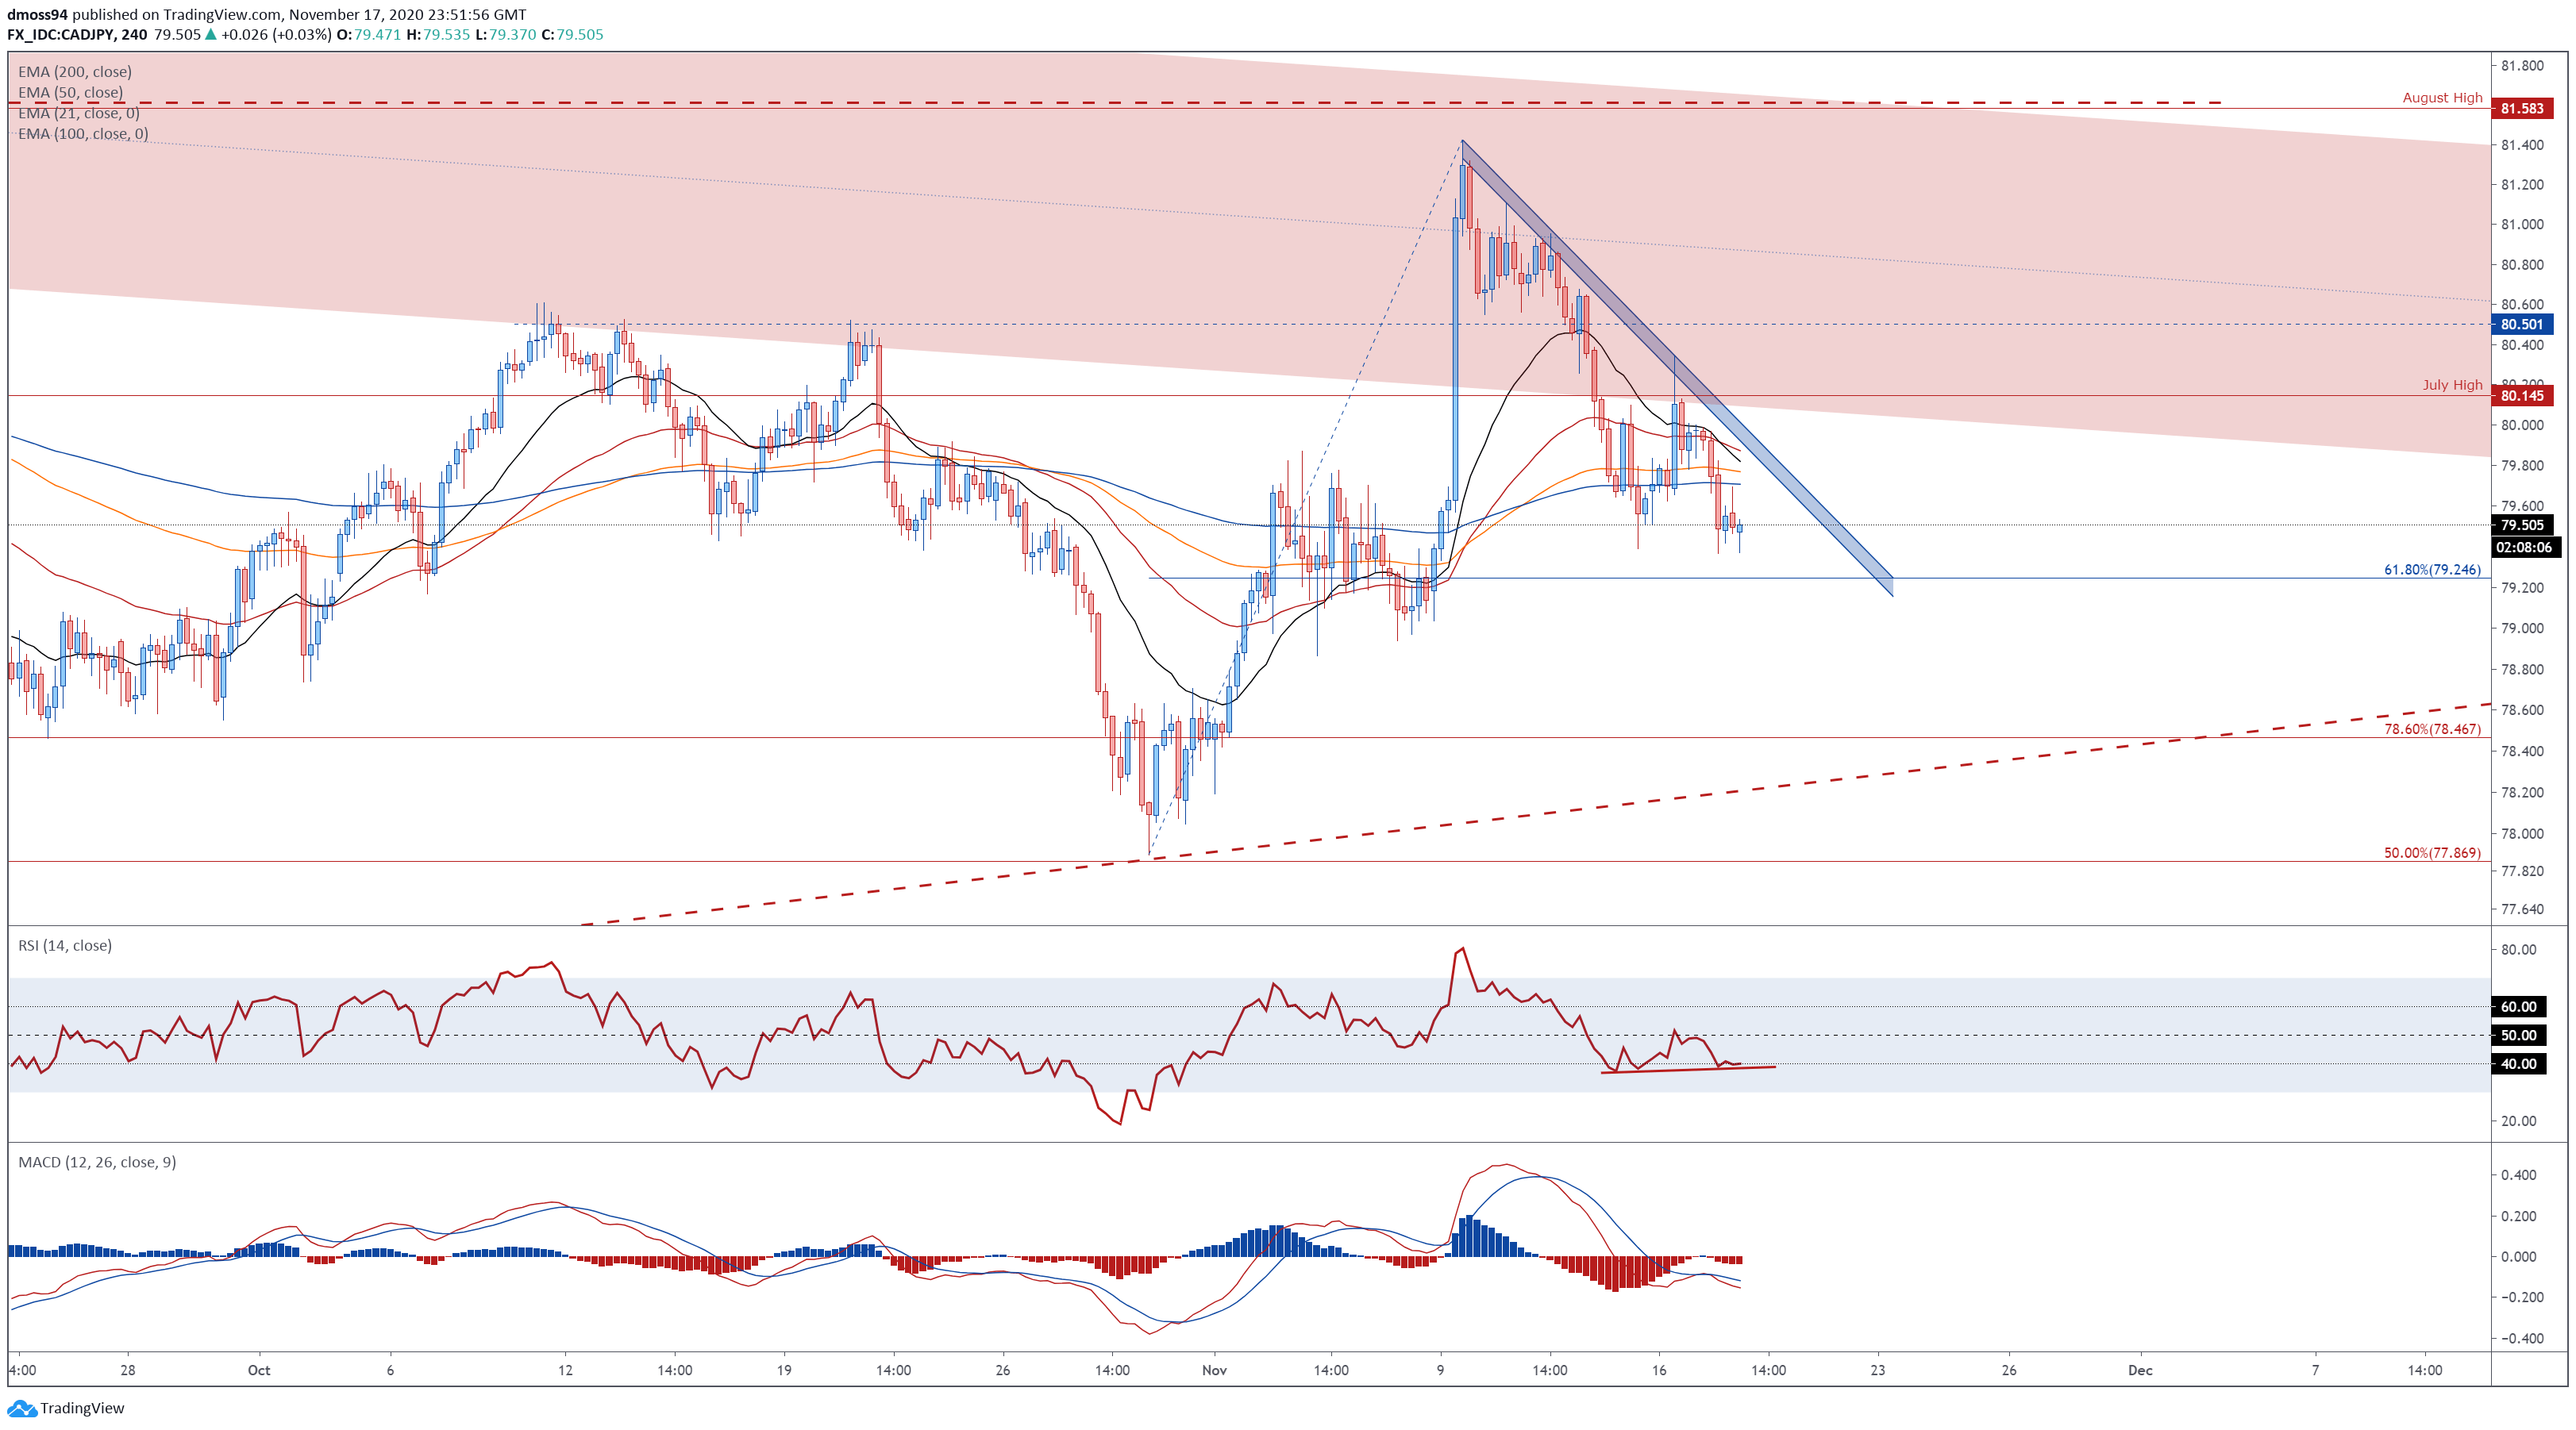
AUD/JPY 4-Hour Chart – 61.8% Fibonacci Hints at Topside Push

AUD/JPY 4-hour chart created using TradingView
Zooming into the four-hour chart seems to bolster the bullish outlook depicted on the daily timeframe.
Prices attempted to break higher after breaching Descending Channel resistance however, the move was cut short by the psychologically imposing 77.00 mark.
This ignited an aggressive short-term pullback towards the trend-defining 50-MA. Tellingly, price held above the 61.8% Fibonacci (75.78), suggesting a continued topside push is on the cards.
Hurdling confluent resistance at the yearly open (76.24) and 21-MA may invite follow through and propel price back towards the monthly high (77.09).
Conversely, sellers could regain control if the 61.8% Fibonacci gives way, opening the door for a pullback towards the support range at 75.35 – 75.45.
CAD/JPY Daily Chart – Ascending Triangle in Play

CAD/JPY daily chart created using TradingView
The technical outlook for CAD/JPY rates remains skewed to the topside, as prices continue to carve out a bullish Ascending Triangle pattern.
However, with price tracking below all four moving averages and a bearish crossover taking place on the MACD indicator, further losses look likely in the near term.
Breaking below the November 17 low (79.39) would probably generate a pullback towards confluent support at the 78.6% Fibonacci (78.47) and triangle uptrend.
On the other hand, climbing back above range resistance at 79.60 – 79.70 could signal uptrend resumption and bring the August high (81.58) into buyers’ cross hairs.
CAD/JPY 4-Hour Chart – Bullish Divergence Hints at Reversal
CAD/JPY 4-hour chart created using TradingView
Scrolling into the 4-hour chart seems to suggest that CAD/JPY could gain ground in the near term, despite sliding over 2.5% from the monthly high set on November 9 (81.42).
Bullish RSI divergence is reflective of fading downside momentum and strengthens the case for an upside scenario, given price is perched firmly above the 61.8% Fibonacci retracement (79.24).
Ultimately, CAD/JPY needs to overcome a convincing push above the 100-MA (79.77) is needed to extinguish short-term buying pressure and carve a path towards the July high (80.14).
Breaking through that would likely signal the resumption of the primary uptrend and put prices on a path to challenge the November high (81.42).
Alternatively, slicing through the 61.8% Fibonacci could intensify selling pressure and generate a pullback towards Ascending Triangle support and the 78.6% Fibonacci (78.47).
GBP/JPY Daily Chart – Carving Out Topping Pattern
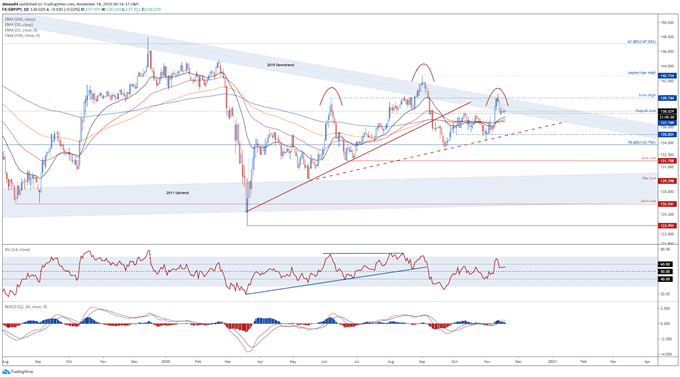
GBP/JPY daily chart created using TradingView
GBP/JPY rates could be poised to slide significantly lower as prices carve out a Head and Shoulders topping pattern.
The swift reversal lower after testing the June high (139.74) propelled price back towards key support at the August low (137.75) and seems to have carved out the pattern’s right shoulder.
Extending downward from here puts the spotlight on the sentiment-defining 200-DMA (136.74), with a breach probably carving a path towards the Head and Shoulders’ neckline and October 2 low (135.05).
Contrarily, upside continuation that cements a foothold above the 140 level would likely open a path to probe the September high (142.71).
GBP/JPY 4-Hour Chart – Bear Pennant Implies Further Downside
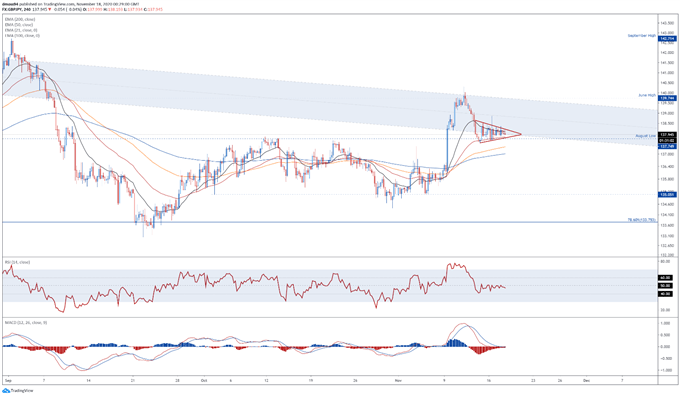
GBP/JPY 4-hour chart created using TradingView
Scrolling into the 4-hour chart hints at further losses as price carves out a Bear Pennant formation above key support at the August low (137.75).
Breaking through the 137.50 mark is required to validate the bearish continuation pattern and could propel price back below the 200-MA (137.02) to fulfil the measured move (135.05).
On the other hand, clambering back above 138.30 would probably neutralize short-term selling pressure and open the door for GBP/JPY to retest the June high (139.74).
-- Written by Daniel Moss, Analyst for DailyFX
Follow me on Twitter @DanielGMoss


