


GBP/JPY Price- Technical Outlook
GBP/JPY Price - Closed in the Green
On Thursday, GBP/JPY rallied to an over two-week high at 134.71 then retreated after as some bulls seemed to cut back. However, the weekly candlestick closed a 1.5% gain.
The British Pound befitted from the reports about the UK government package to boost the economy including cut to VAT and house stamp duty.
GBP/USD Outlook Brighter, EUR/GBP Dimmer After UK Mini Budget
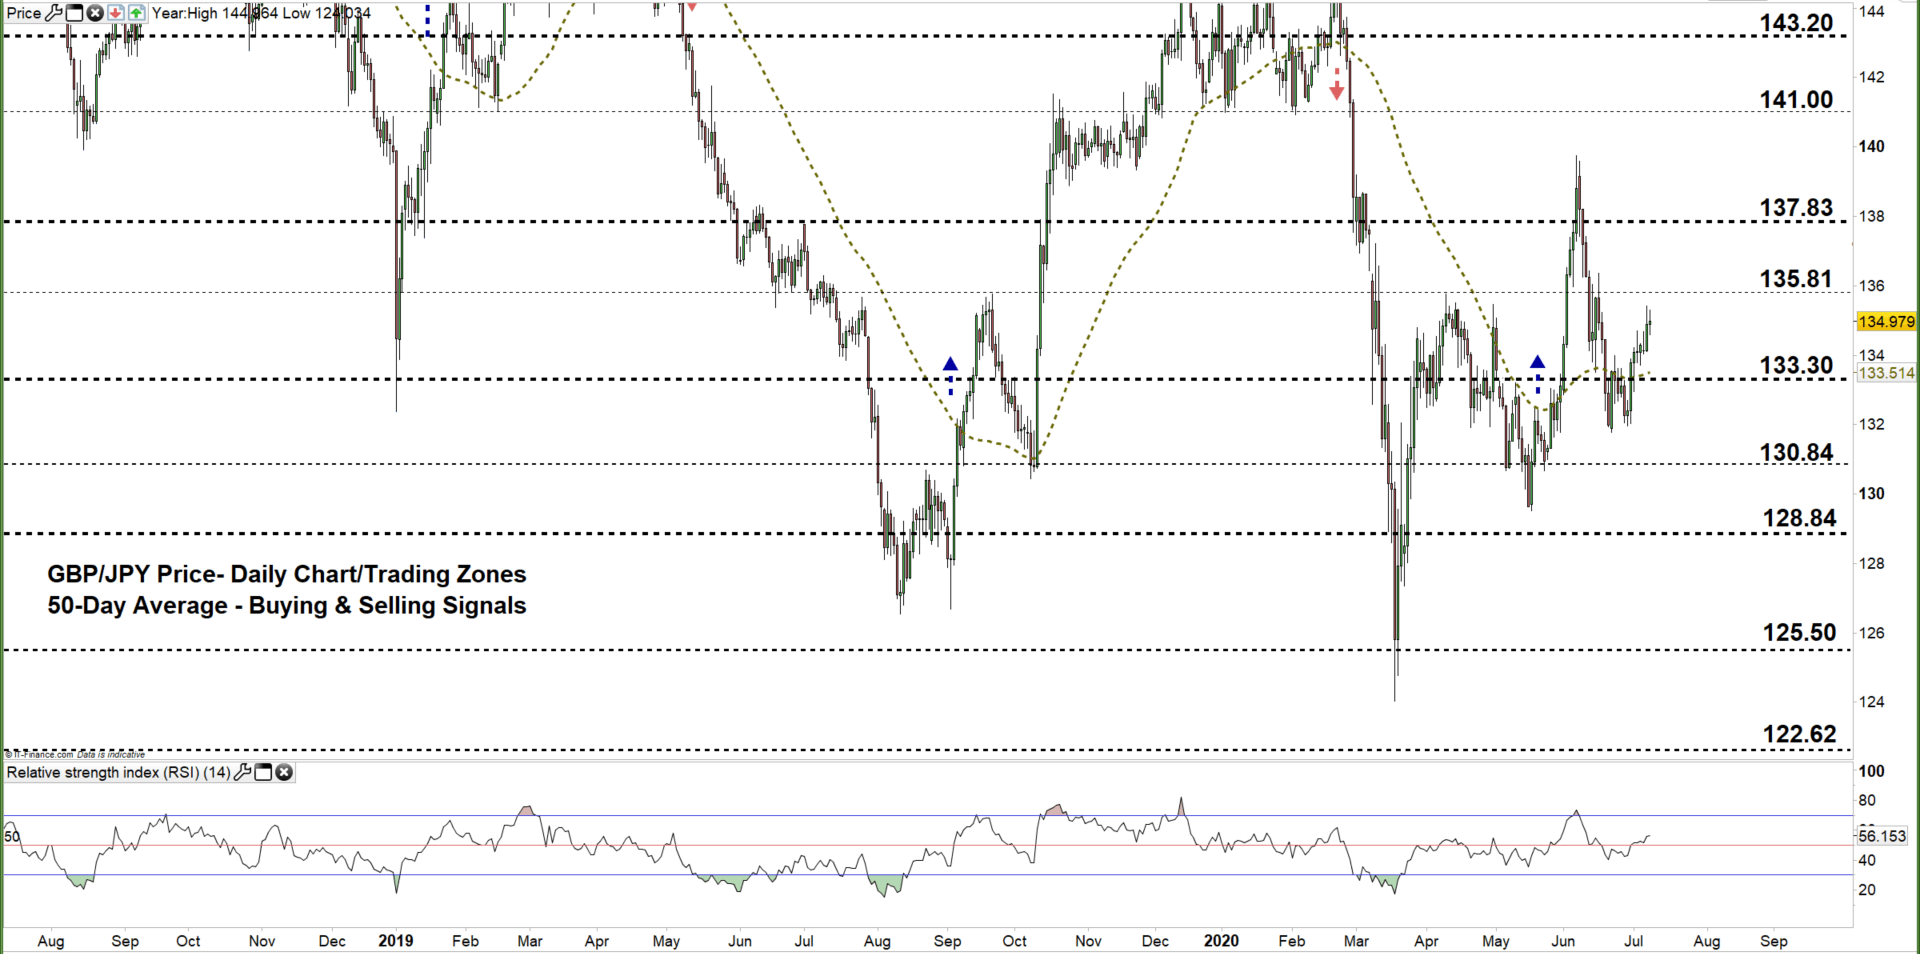
GBP/JPY Daily PRice CHART ( July 8, 2018 – JuLY 8, 2020) Zoomed Out

GBP/JPY Daily PRice CHART (March 26 – JUly 8, 2020) Zoomed In
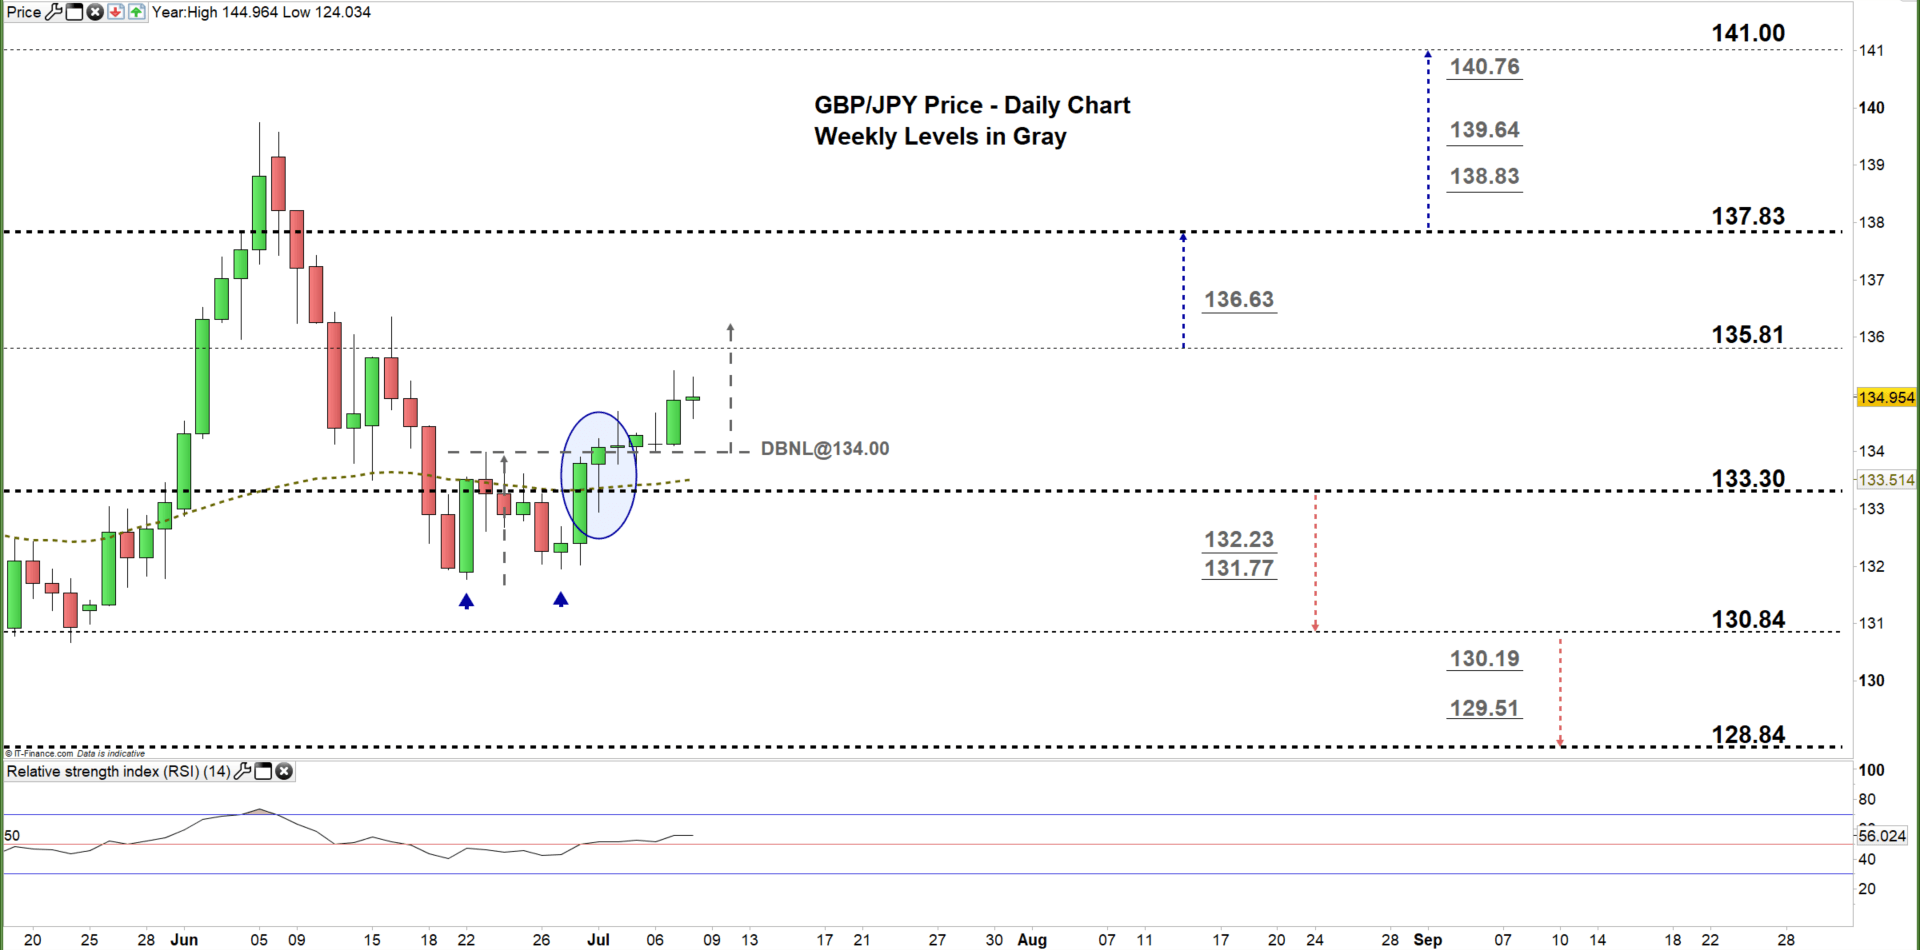
By the end of June, GBP/JPY climbed to the current trading zone 133.30 – 135.81, and on the following day, the pair broke above the neckline of the double bottom pattern located at 134.00 and generated another bullish signal. Therefore, the price rallied yesterday to a three-week high at 135.41.
A close above the high end of the current trading zone signals that bulls could push GBPJPY towards 137.83 and any further close above that level may encourage them to extend the rally towards the 141.00 handle.
On the other hand, any close below the low end of the zone could send the price towards 130.84, and any further close below that level may embolden bears to press the market towards 128.84.

GBP/JPY Four Hour PRice CHART (May 22 – JuLY 8, 2020)
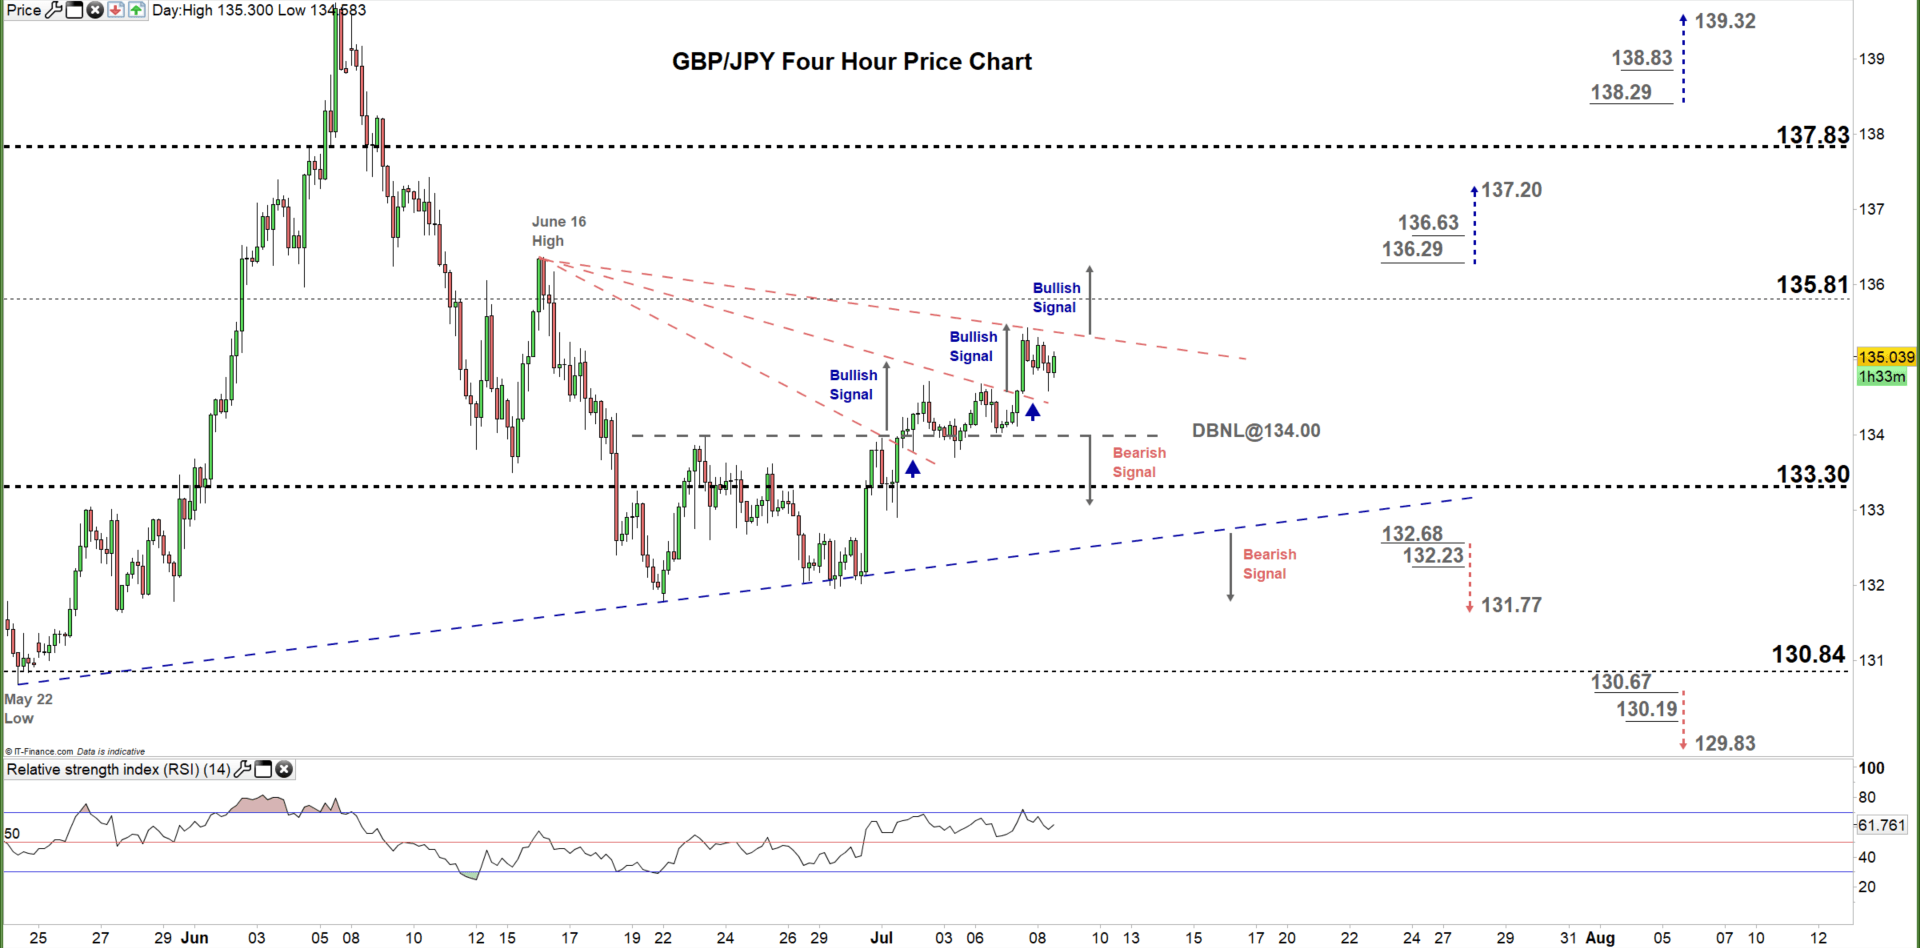
Last week, GBP/JPY broke and remained above two of the downtrend lines fan originated from the June 16 high at 136.35 indicating that bulls were in charge. Therefore, a break above the third downtrend line on the same fan would produce another bullish signal, while a break below the uptrend line originated from the May 22 low would generate a bearish signal.
To conclude, a break above 136.29 may cause a rally towards 137.20 while, a break below 132.68 could send GBPJPY towards the June 22 low at 131.77. That said, the weekly support and resistance levels underlined on the four-hour chart should be monitored.
Written By: Mahmoud Alkudsi,Market analyst
Please feel free to contact me on Twitter: @Malkudsi


