


GBP/JPY Technical Forecast
GBP/JPY- Slower Bearish Momentum
On May 18, GBP/JPY declined to an over eight-week low at 129.51. However, the price rallied after as some bears seemed to cover and as a result, the weekly candlestick closed on Friday in the green with a 1.0% gain.
Alongside this, the Relative Strength Index (RSI) rose from 48 to 48, highlighting a weaker bearish move.
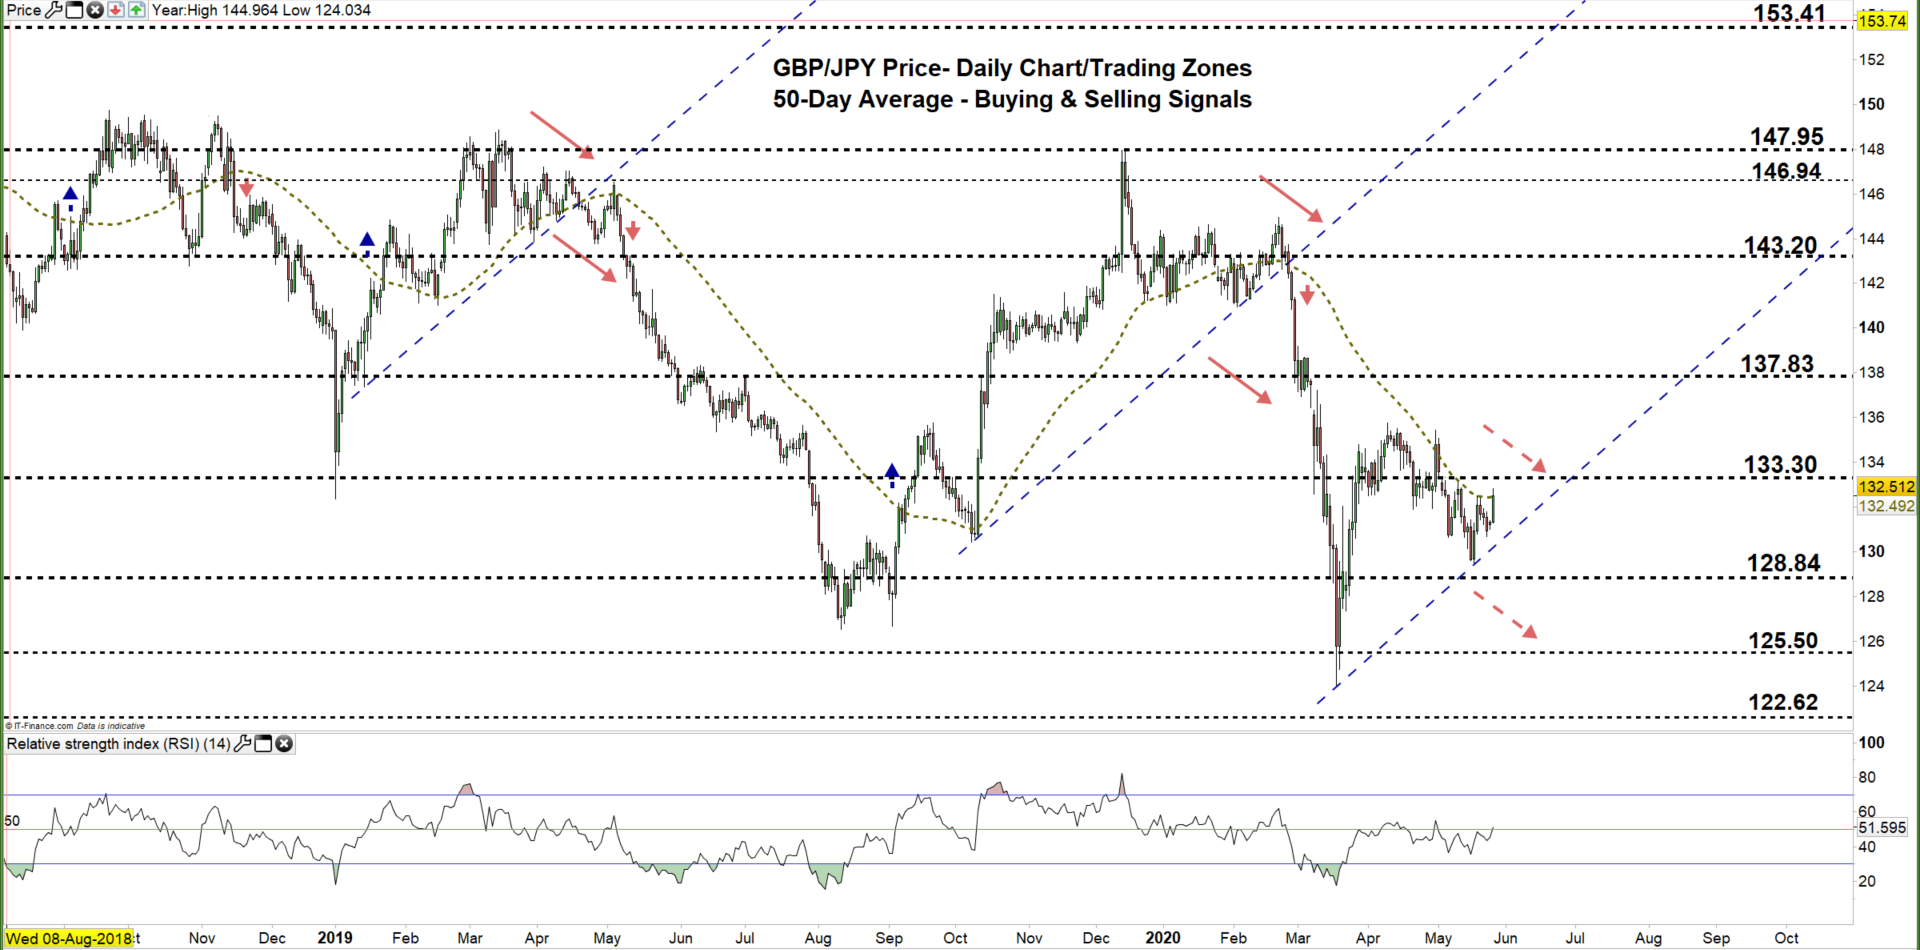
GBP/JPY Daily PRice CHART (AUG 8, 2018 – May 26, 2020) Zoomed Out

GBP/JPY Daily PRice CHART (FEB 29 – MAy 26, 2020) Zoomed In

Based on analysis of the daily chart, in early May GBP/JPY closed below the 50-day moving average then started a bearish momentum creating lower highs with lower lows. However, the pair remained in the current trading zone 128.84 – 133.30 reflecting that bears were losing momentum.
A close above the high end of the aforementioned zone would correct the downtrend and might cause a rally towards 137.83. A further close above that level may extend this rally towards 143.20. In that scenario, the weekly resistance levels underscored on the chart (zoomed in) should be monitored.
On the flip-side, any failure in closing above the high end of the zone could reverse the pair’s direction towards the low end of the zone. A further close below that level may send GBPJPY even lower towards 125.50. That said, the weekly support level and area marked on the chart should be watched closely.

GBP/JPY Four Hour PRICE CHART (April 29 – MAY 26, 2020)
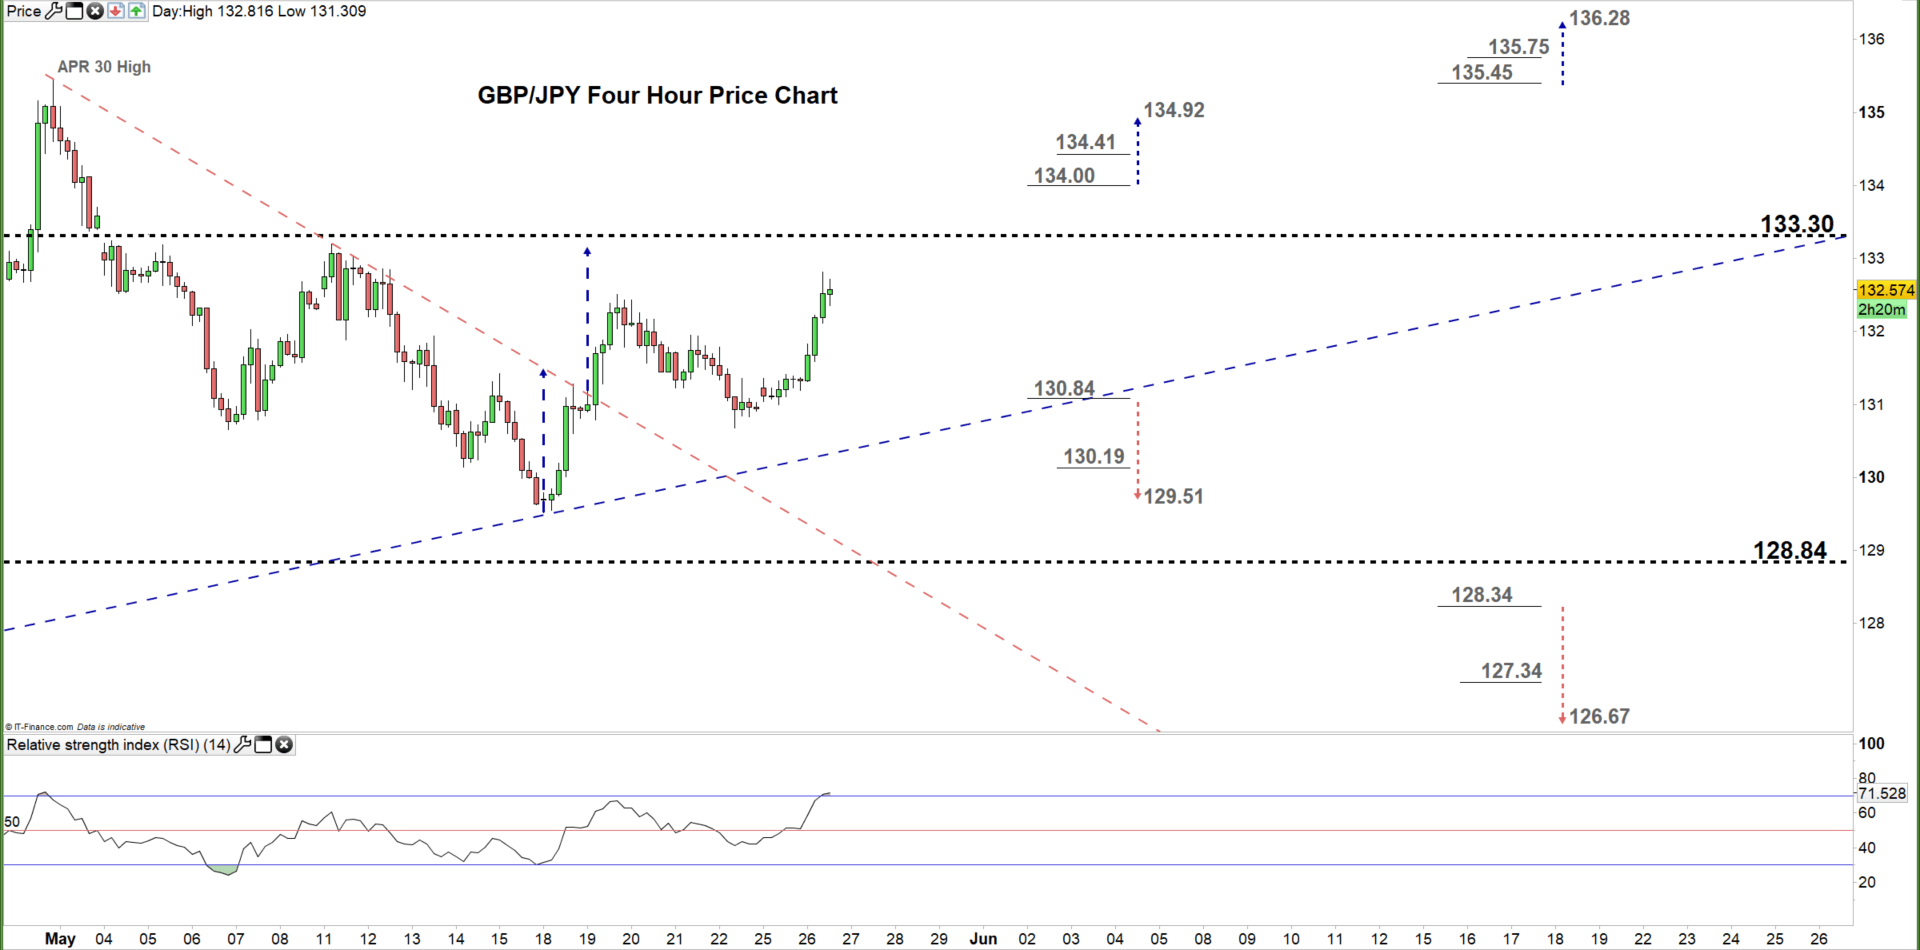
Looking at a four-hour chart, on Tuesday GBP/JPY rallied above the downtrend line originated from the April 30 high at 135.45 and generated a bullish signal.
A break above the 134.00 handle would produce an additional bullish signal and may trigger a rally towards 134.92. Although, the weekly resistance level underlined on the chart should be kept in focus. In turn, a break below 130.84 could send GBPJPY towards 129.51. Nonetheless, the daily support level printed on the chart should be considered.

Written By: Mahmoud Alkudsi,Market analyst
Please feel free to contact me on Twitter: @Malkudsi


