


EUR /JPY & GBP/JPY Technical Outlook
Bears in Charge
Last week, EUR/JPY rallied to 120.95 then declined after and closed the weekly candlestick with a bearish Doji pattern, signaling that bears would probably control the price action.
On the other hand, GBP/JPY retreated to its lowest level in over four months at 136.94, then rallied after and settled above the 137.00 handle. On Friday, the market closed the weekly candlestick in the red with 0.7% loss.
The Relative Strength Index (RSI) remained below 50 on both pairs indicating that downtrend move was still intact.
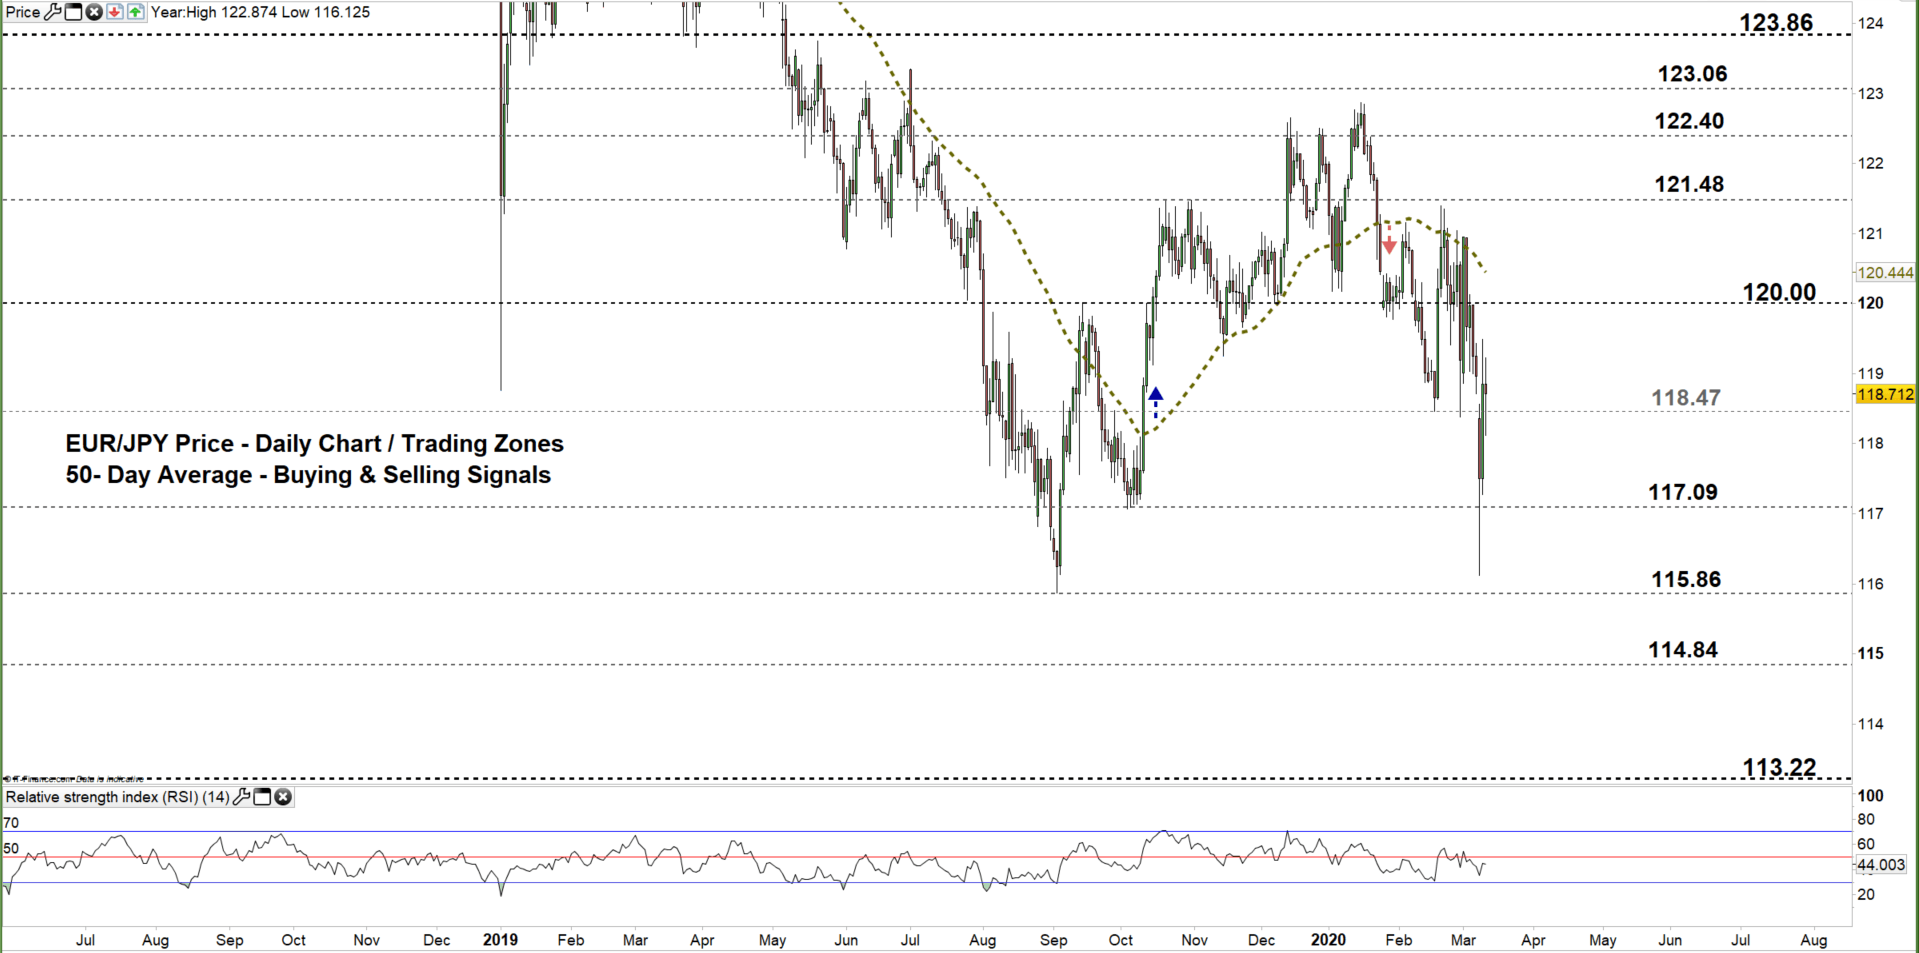
EUR/JPY Daily PRice CHART (JUn 21, 2018 – Mar 11, 2020) Zoomed Out

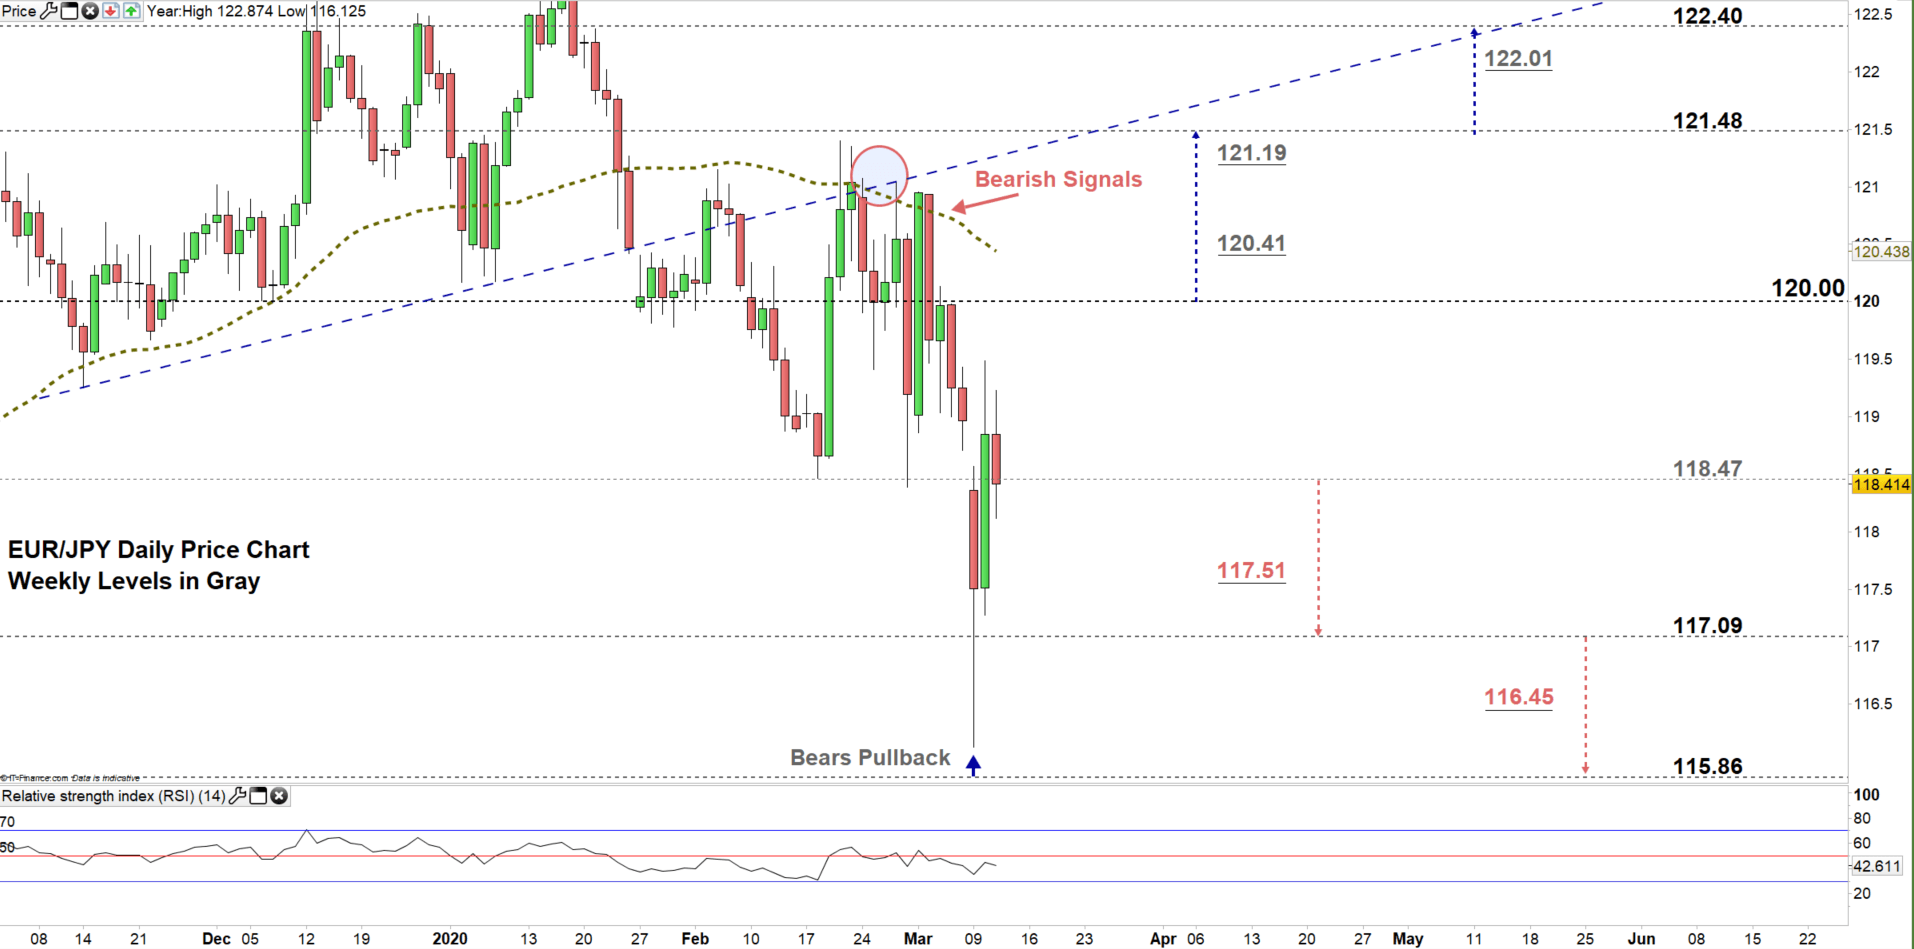
EUR/JPY Daily Price CHART (Oct 15 – Mar 11, 2020) Zoomed in
Looking at the daily chart, we noticed that last week, EUR/JPY closed below the 50-day average providing a bearish signal. Consequently, bears took charge and pressed below the support level 117.09 discussed in our last update .
This week, the price has tumbled to its lowest level in nearly six months at 116.12 , then rallied as bears seemed to cover. Yesterday, the market surged to a higher trading zone 118.47- 120.00 eyeing a test of the high end of it.
A close above the high end may lead EURJPY a rally towards 121.48. Further close above that level opens the door for bulls to push towards 122.40. That said, the weekly resistance levels underlined on the chart (zoomed in) should be considered.
On the other hand, a close below the low end may entice bears to press EURJPY towards 117.09. Further close below that level could mean more bearishness towards 115.86. In that scenario, the daily support levels underscored on the chart would be worth monitoring.
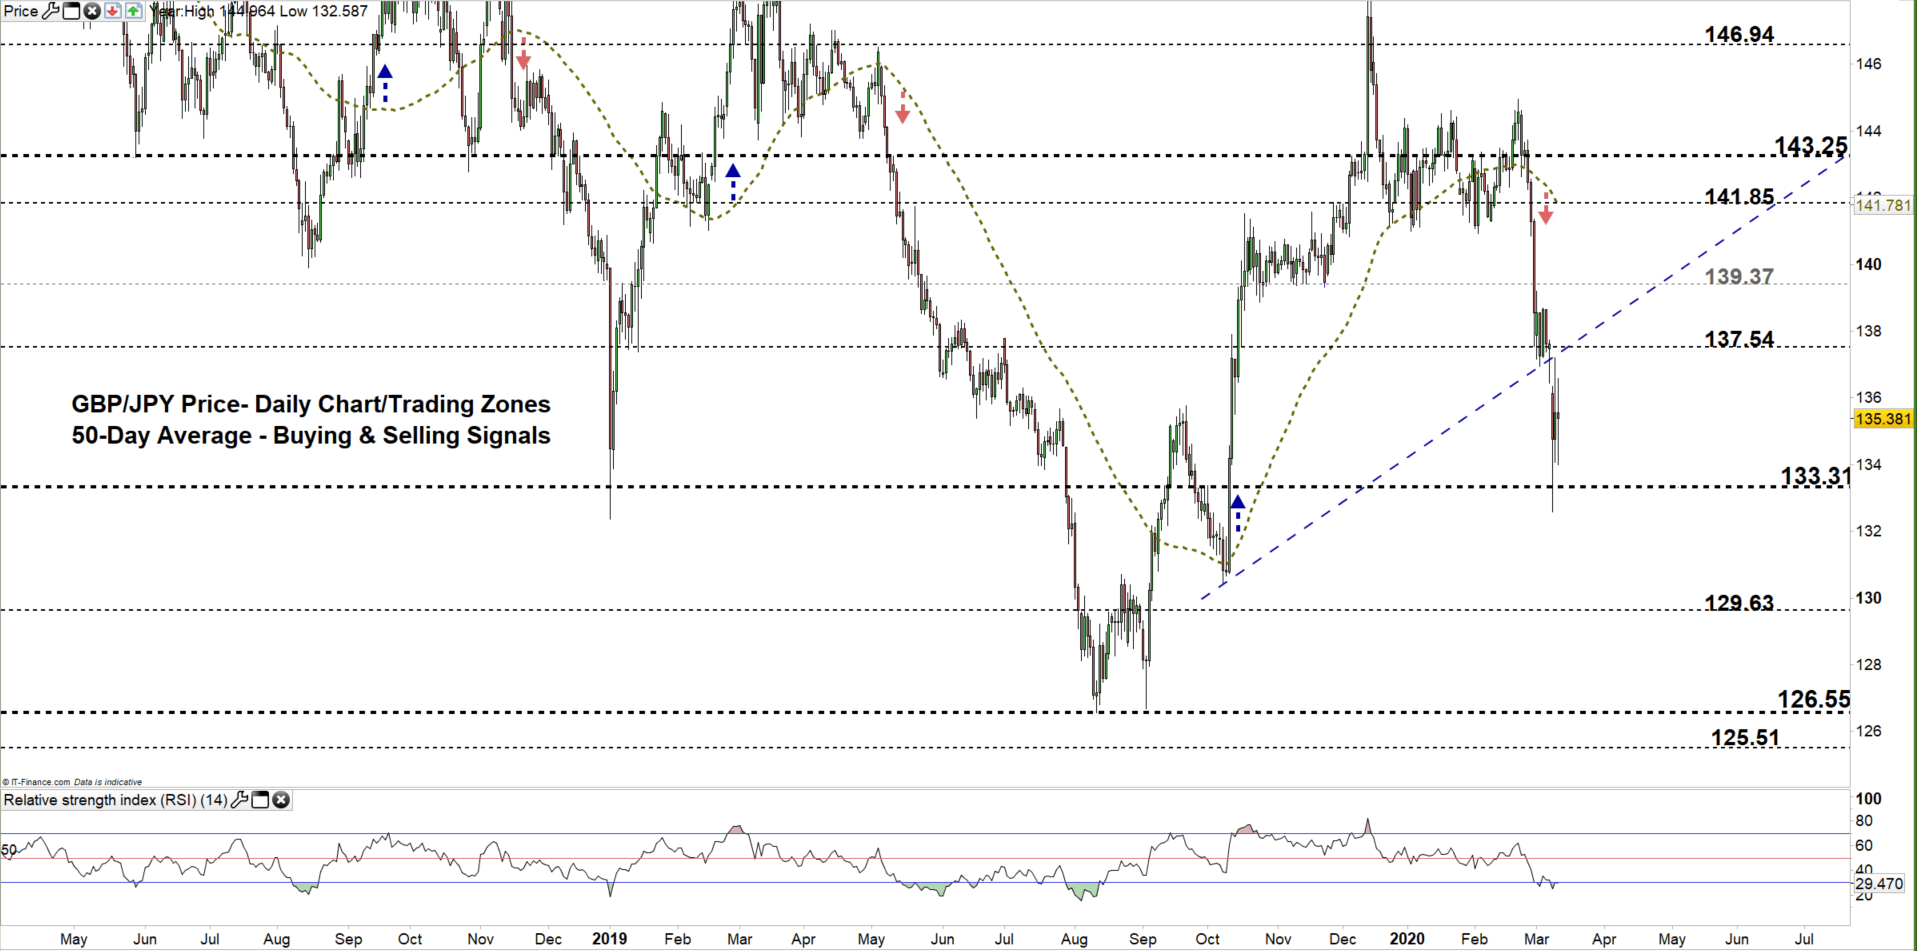
GBP/JPY Daily PRice CHART (April 20, 2018 – Mar 11, 2020) Zoomed Out

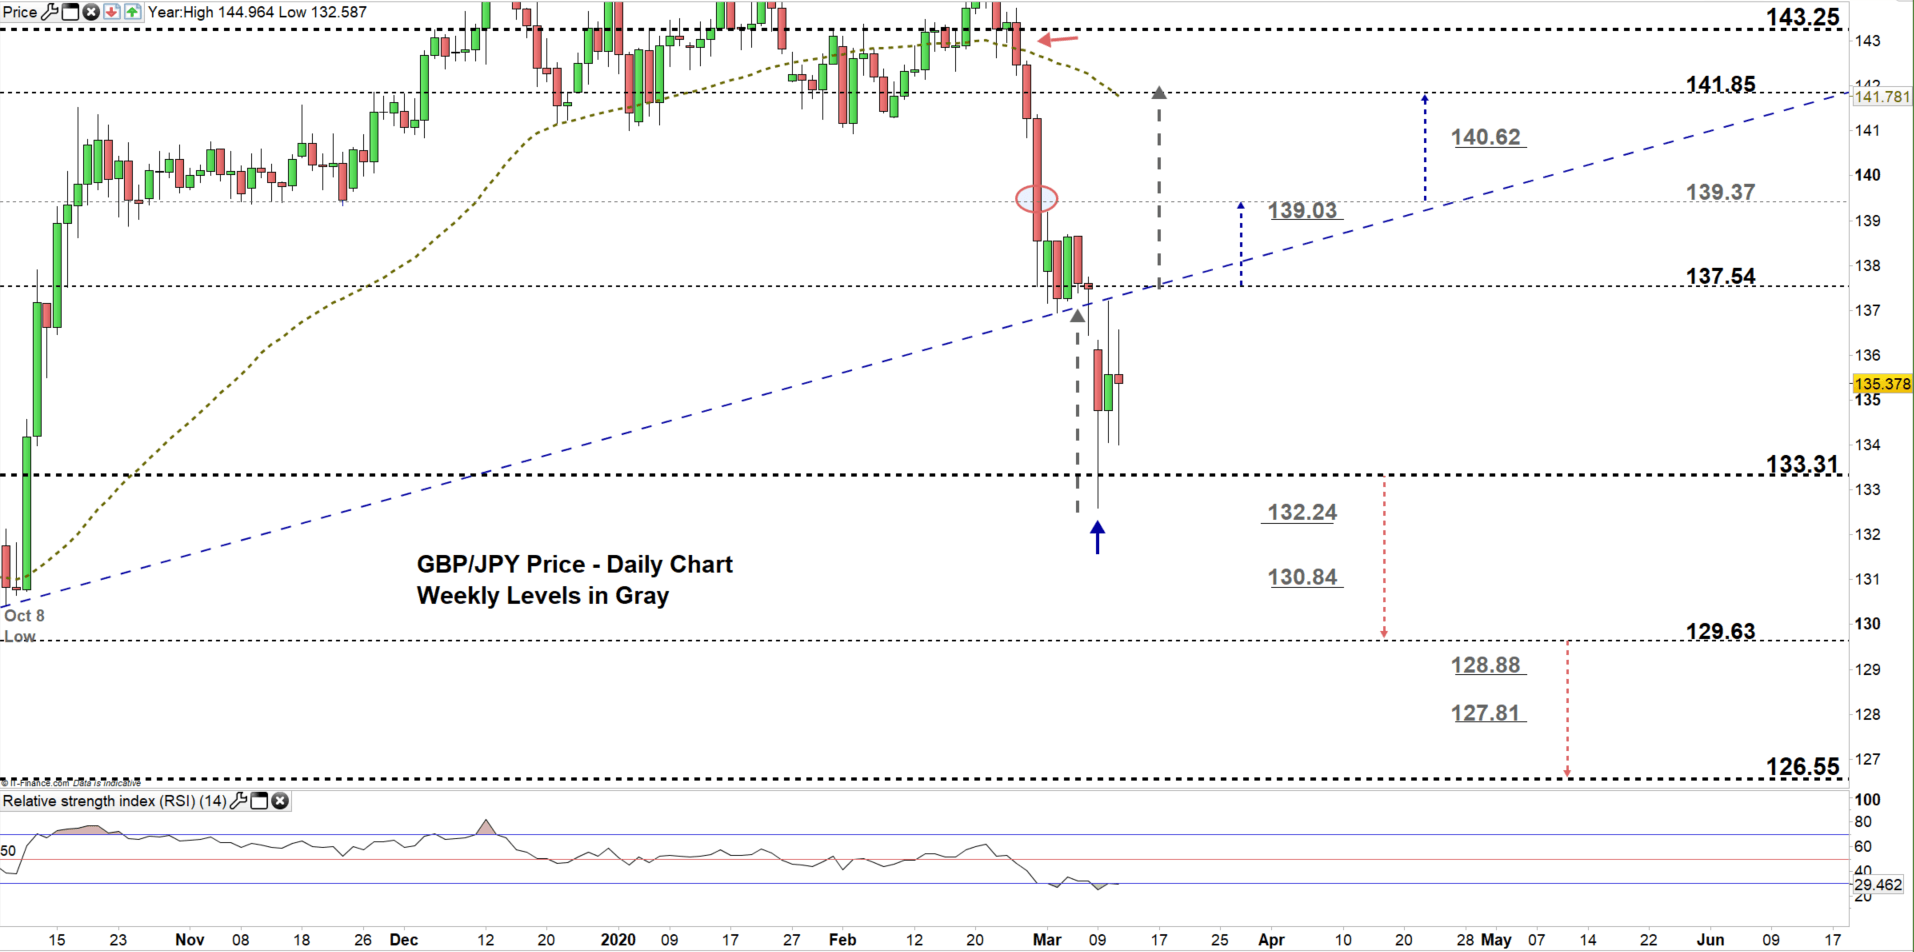
GBP/JPY Daily PRice CHART (Oct 5 – Mar 11, 2020) Zoomed In
From the daily chart, we noticed that on Friday GBP/JPY moved to a lower trading zone 133.31 – 137.54. This week, the price failed to move the lower trading zone, indicating bears hesitation at this stage.
Thus, a close above the high end of the zone might cause a rally towards 139.37. Further close above that level may push GBPJPY towards 141.85. Nevertheless, the weekly resistance levels underscored on the chart (zoomed in) should be kept in focus.
Its worth noting that, yesterday the price rebounded from the uptrend line originated from the Oct 8 low at 130.43. A break above this line could send the pair towards 141.85. Special attention should be paid to the aforementioned levels and trading zones.
On the flip-side, a close below the low end of the zone could encourage bears to press towards 129.63. Further close below that level may cause more bearishness towards 126.55. Although, the weekly support levels marked on the chart should be watched closely.

Written By: Mahmoud Alkudsi
Please feel free to contact me on Twitter: @Malkudsi


