


EUR /JPY and GBP/JPY Technical Outlook
- Euro and British pound against Japanese Yen analysis
- EUR/JPY and GBP/JPY price charts
GBP/JPY, EURJPY – Price Action
Last week, both Euro and British pound rallied against Japanese Yen. On Friday, EUR/JPY closed the weekly candlestick in the green with a 0.9% gain, meanwhile GBP/JPY closed with a 1.1% gain.
This week, the Relative Strength Index (RSI) remained flat above 50 on both pairs highlighting a paused uptrend momentum.

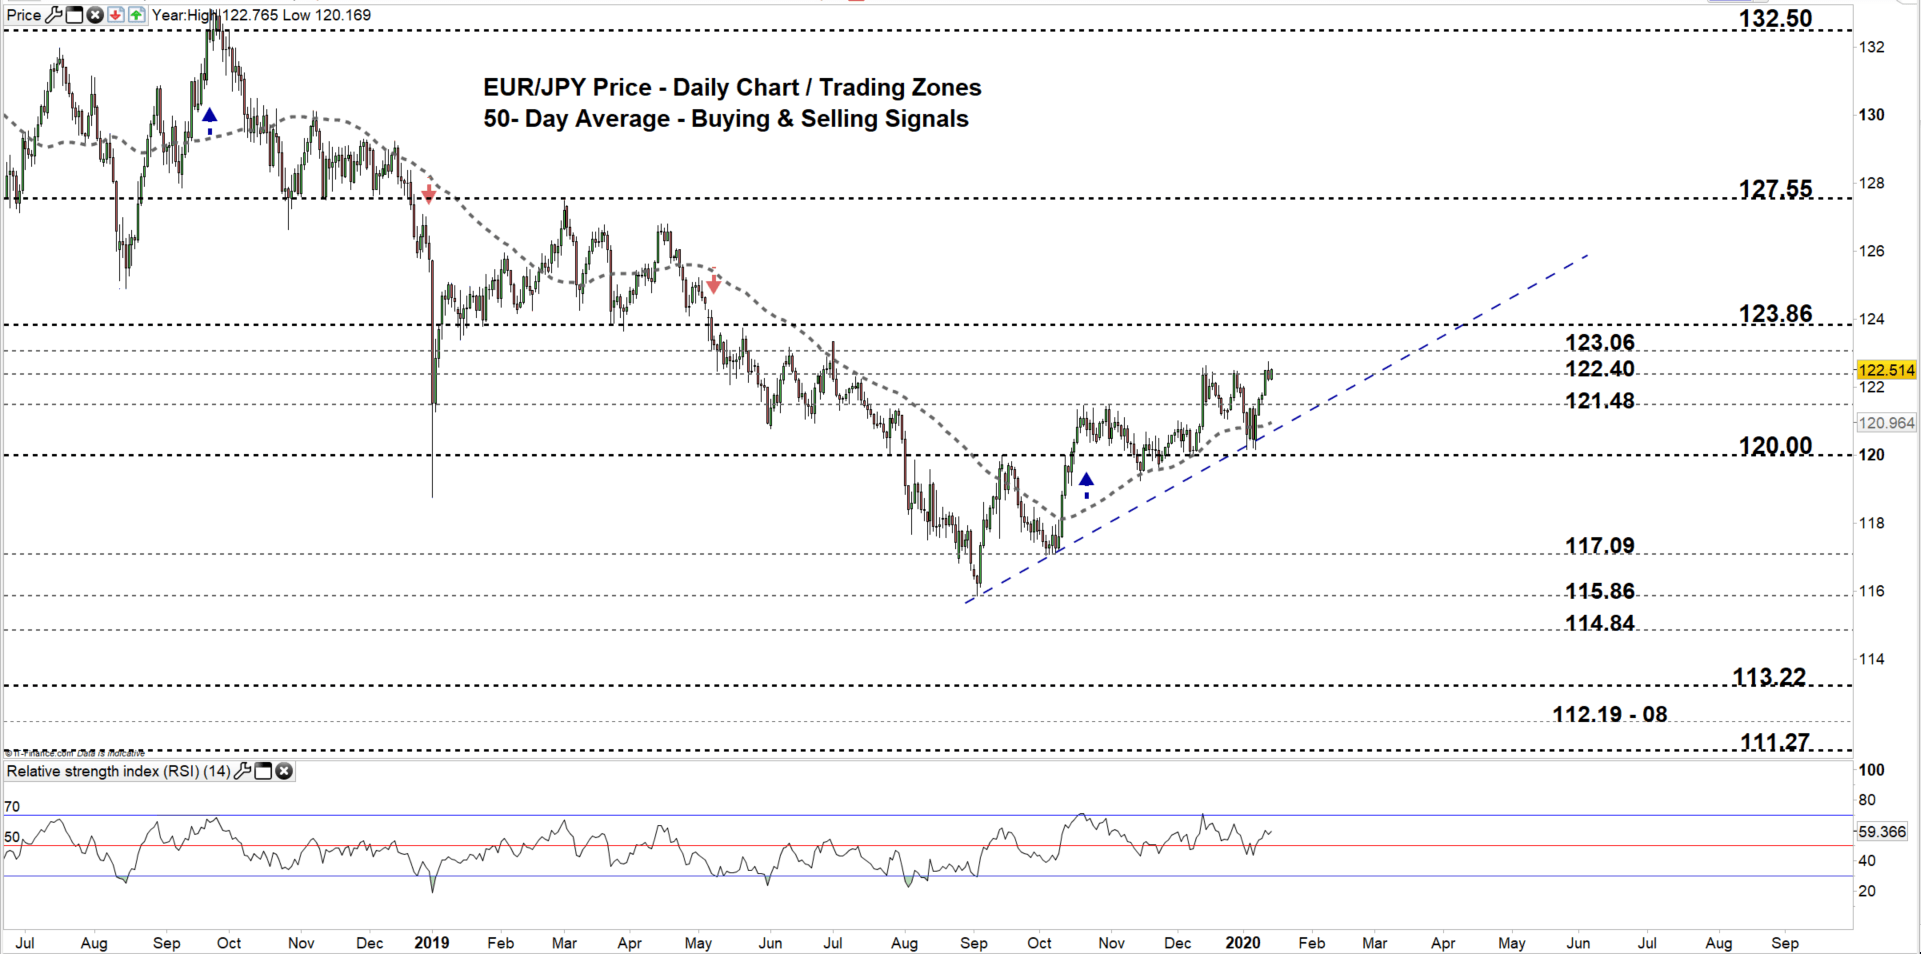
EUR/JPY Daily PRice CHART (Jun 25, 2018 – JAn 15, 2020) Zoomed Out
EUR/JPY Daily Price CHART (Sep 25 – JAn 15, 2020) Zoomed in

Looking at the daily chart, we notice since Jan 3 sellers has shown signs of hesitation to lead the price. This opened the door for buyers to come back. On Jan 8, the pair closed above 50-Day average providing another bullish signal.
Yesterday, EUR/JPY rallied to 122.76- its highest level in over six months. However, the price declined after to a lower trading zone 121.48 – 122.40 as some buyers took profit.
A close above the high end of the zone could persuade buyers to push towards 123.06. Further close above this level opens the door for GBP/JPY to rally towards 123.86. Nevertheless, the weekly resistance levels underlined on the chart (zoomed in) should be considered.
On the flip-side, another close below the high end of the zone could convince more buyers to exit the market. This could send the price towards the low end. Further close below the low end might pave the way for sellers to take charge and lead the price towards 120.00 handle. Yet, the daily support levels marked on the chart should be watched along the way.

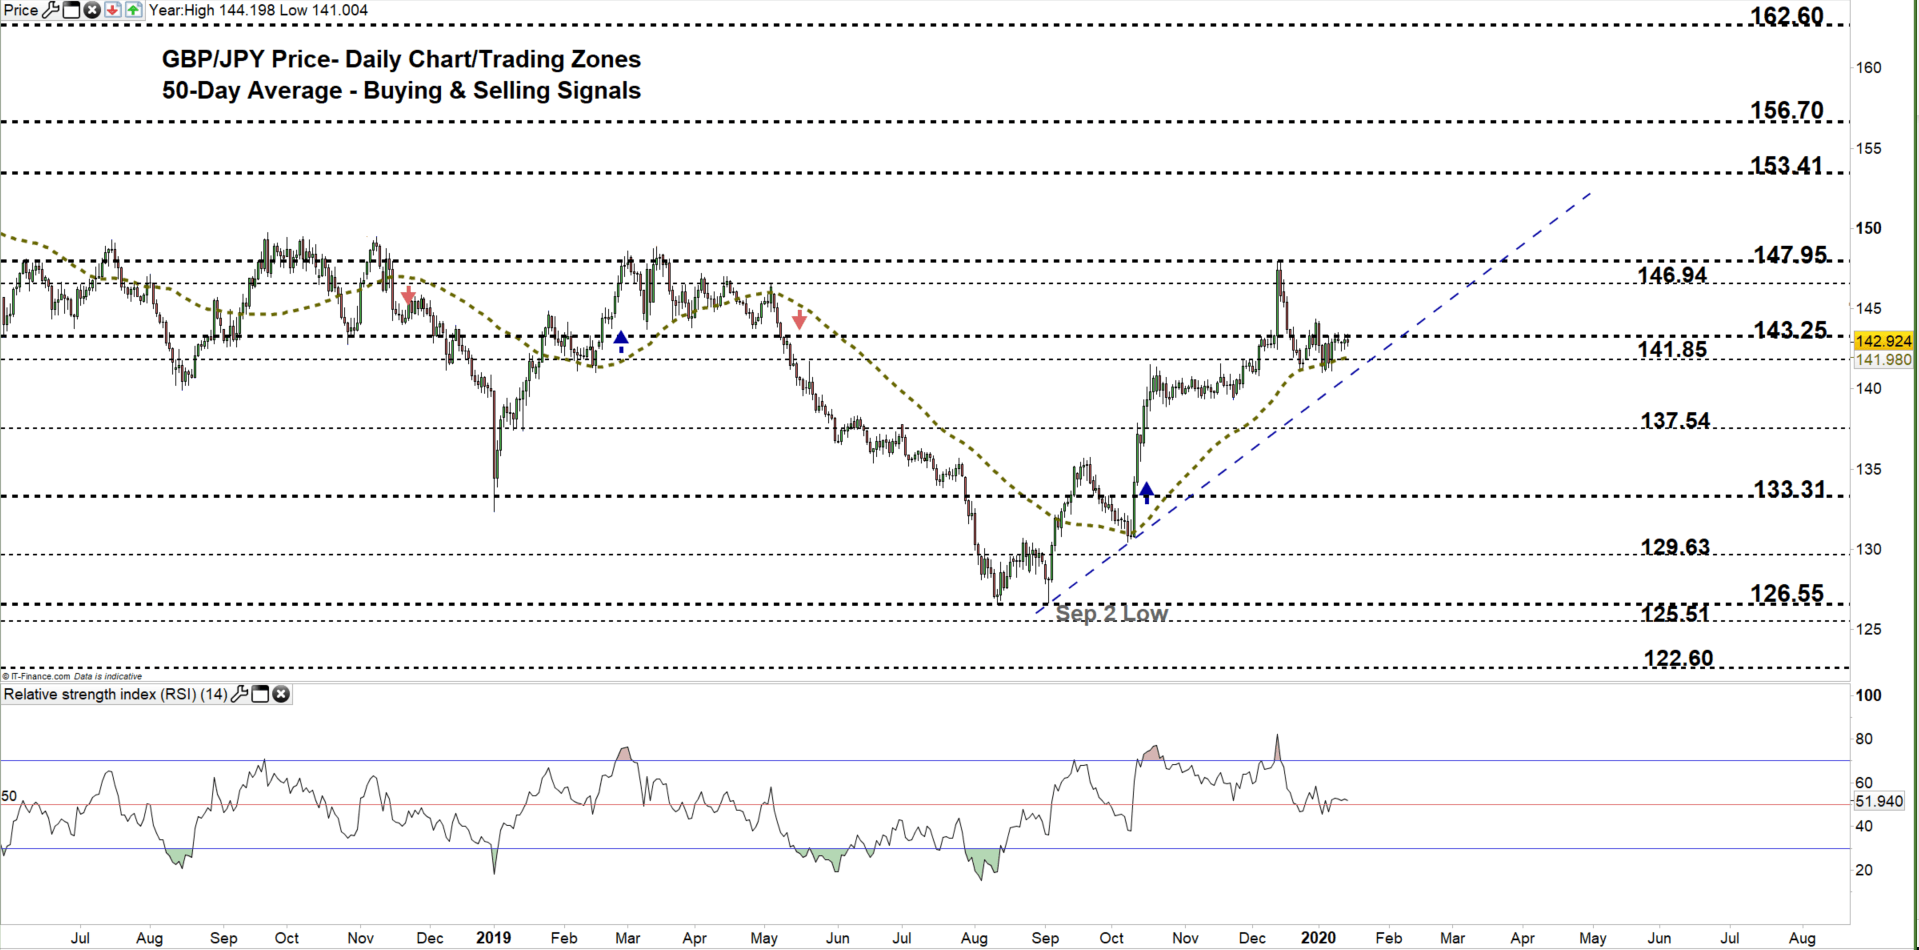
GBP/JPY Daily PRice CHART (Aug 20, 2018 – JAn 15, 2020) Zoomed Out
GBP/JPY Daily PRice CHART (April 25 – JAn 15, 2020) Zoomed In
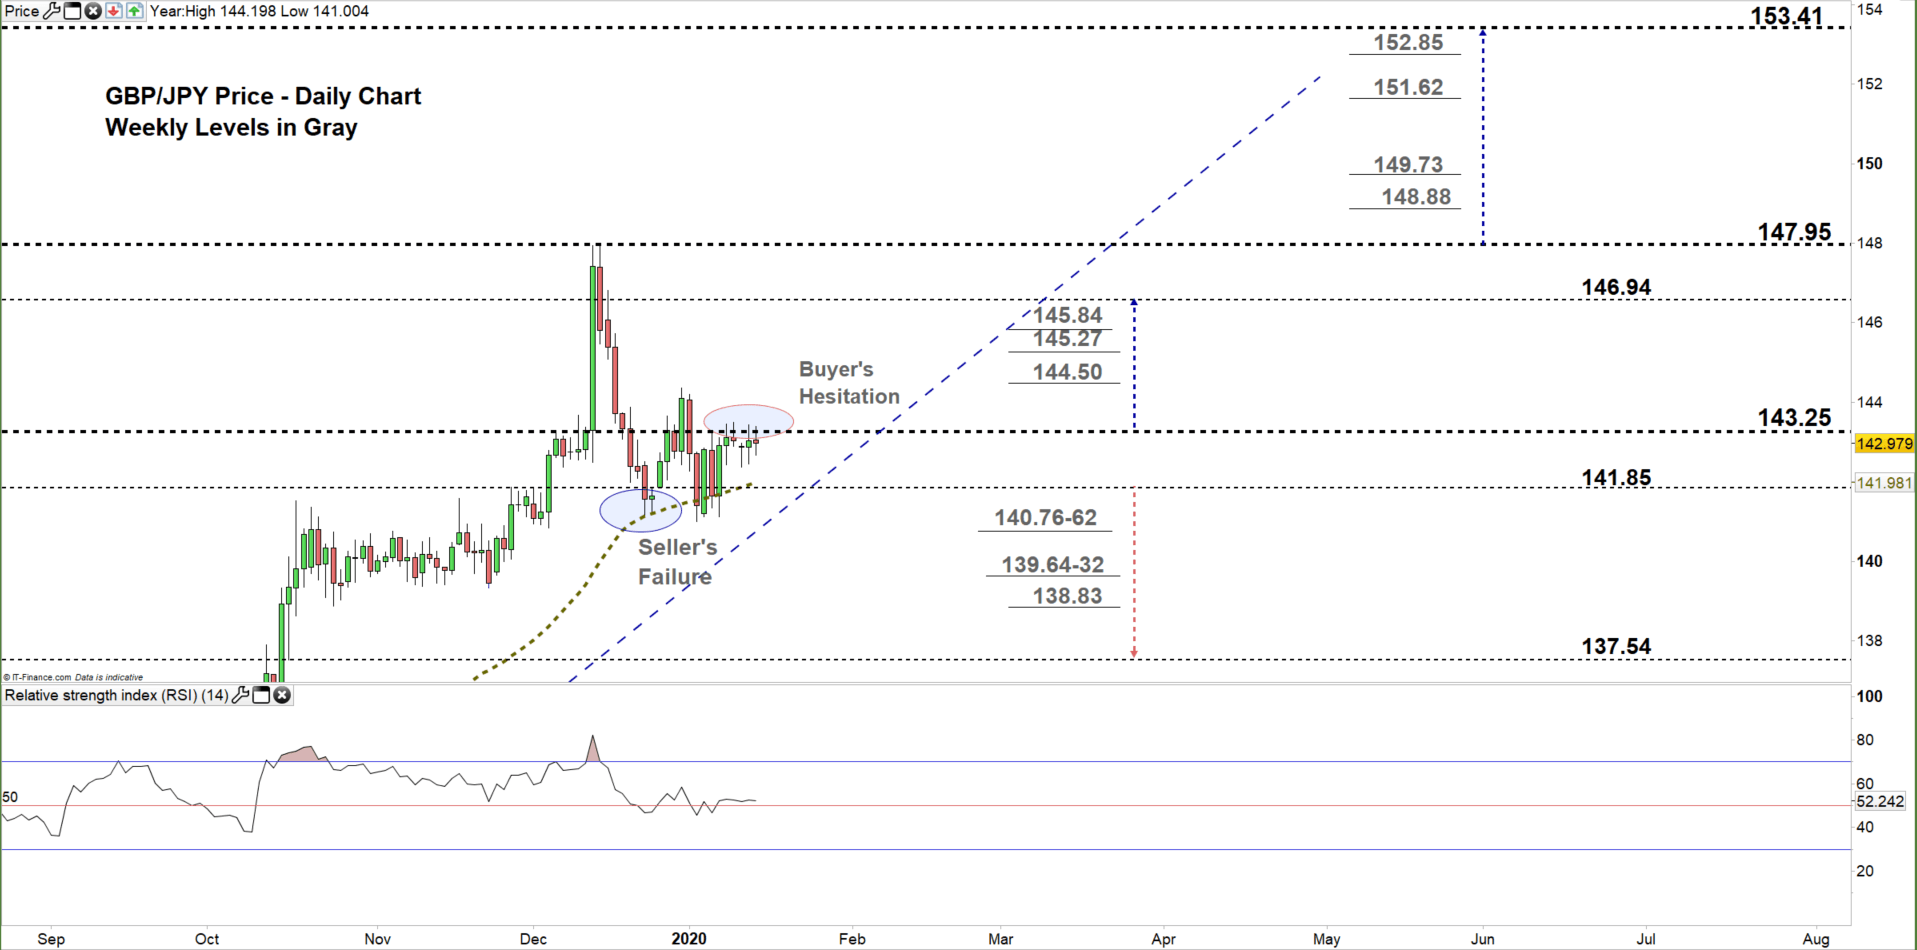
From the daily chart, we notice in Dec last year GBP/JPY rebounded twice from 50-Day average then rallied signaling seller’s failure to lead the price. On Jan 7, the pair rebounded nearby the high end of current trading zone 141.85 – 143.25. Since then, the price failed in multiple occasions in rallying to a higher trading zone reflecting buyer’s hesitation at this stage.
A close above the high end may end this hesitation and encourage buyers to push towards 146.94 contingent on clearing the weekly resistance levels underlined on the chart. Further close above 147.95 could cause more bullishness towards 153.41. Special attention should be paid at the weekly resistance levels as some traders may exit/join the market nearby these points.
That said, a close below the low end could open the door again for sellers to press towards 137.54. Although, the weekly support areas and level marked on the chart should be kept in focus.
Just getting started? See our Beginners’ Guide for FX traders
Written By: Mahmoud Alkudsi
Please feel free to contact me on Twitter: @Malkudsi


