


EUR /JPY and GBP/JPY Forecast
- Euro and British pound price action against Japanese Yen
- EUR/JPY and GBP/JPY price charts
See Our latest trading guides for free and discover what is likely to move the markets through Q4 of this year.
GBP/JPY, EURJPY – Stalled Rally
On Monday, Japanese Yen weekend slightly against Euro and British pound. This pushed EUR/JPY towards 120.68 – its highest level in nearly two weeks. Meanwhile, GBP/JPY rallied to 141.57- its highest level in nearly six months. However, both pairs could not maintain those gains.
The Relative Strength Index (RSI) remained flat above 50 on both pairs, highlighting weak buyers in a bullish market.
Having trouble with your trading strategy? Need a hand? Here’s the #1 Mistake That Traders Make
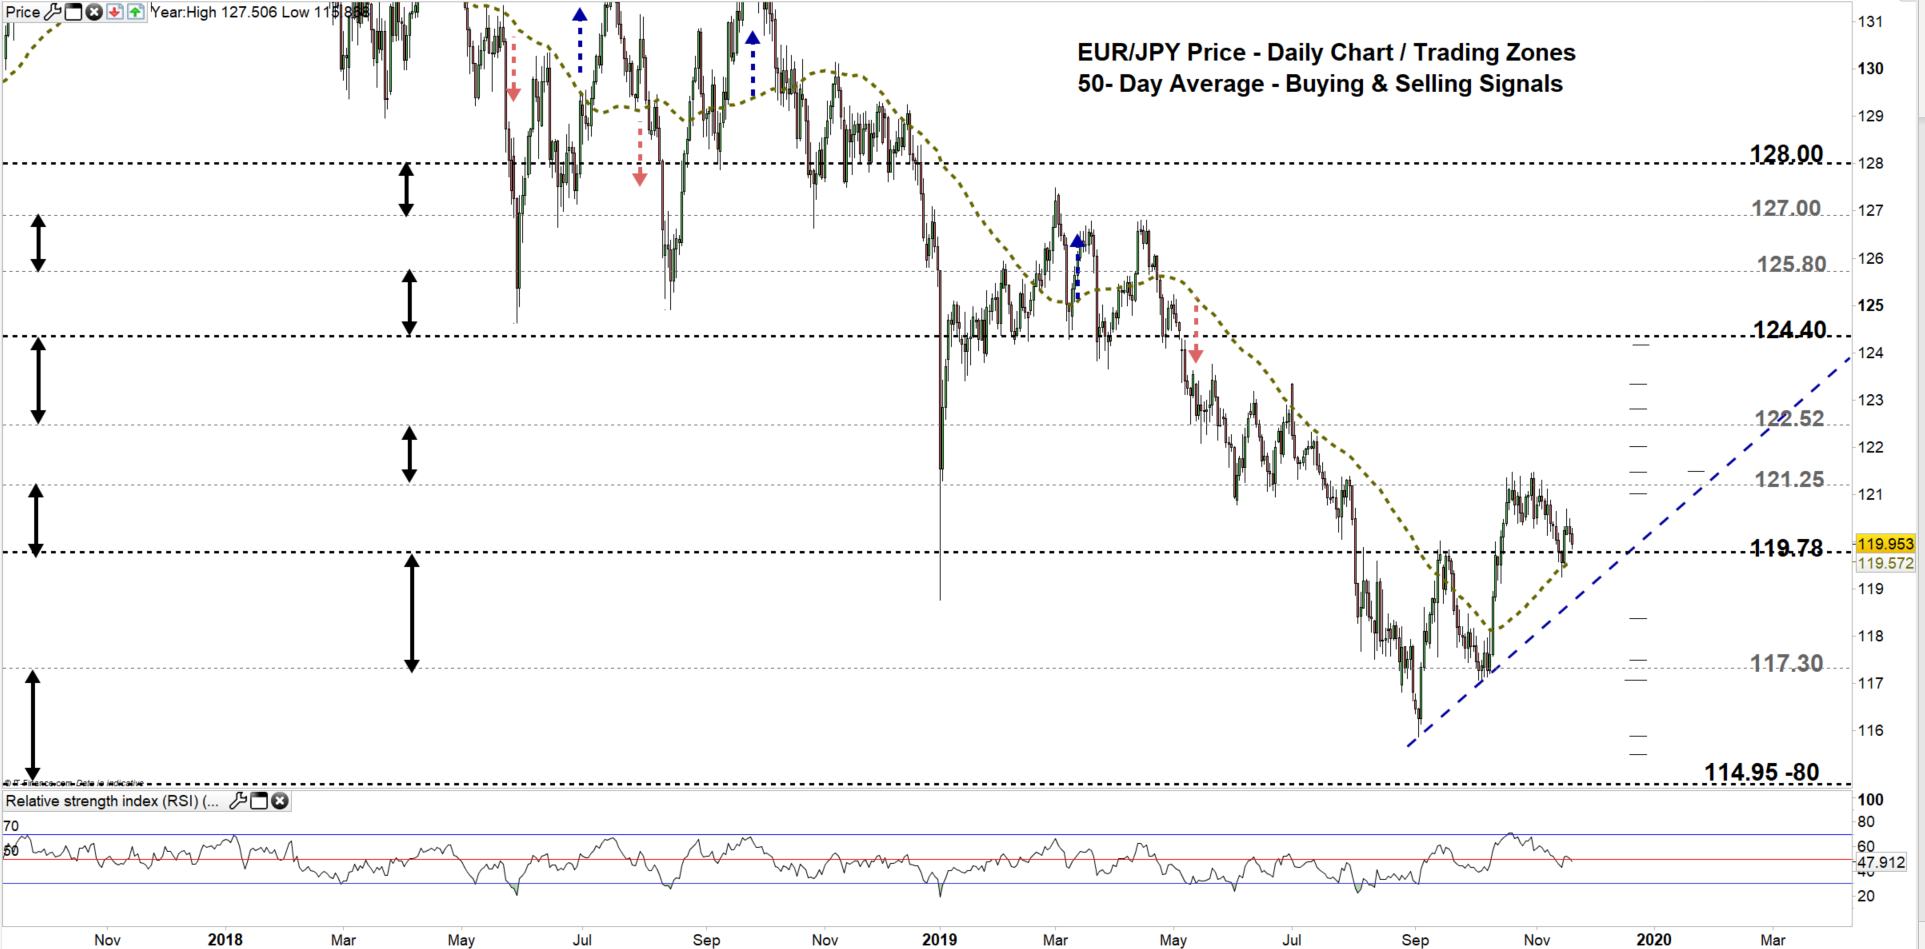
EUR/JPY Daily PRice CHART (AUG 20, 2017 – Nov 20, 2019) Zoomed Out
EUR/JPY Daily Price CHART (July 1 – Nov 20, 2019) Zoomed in
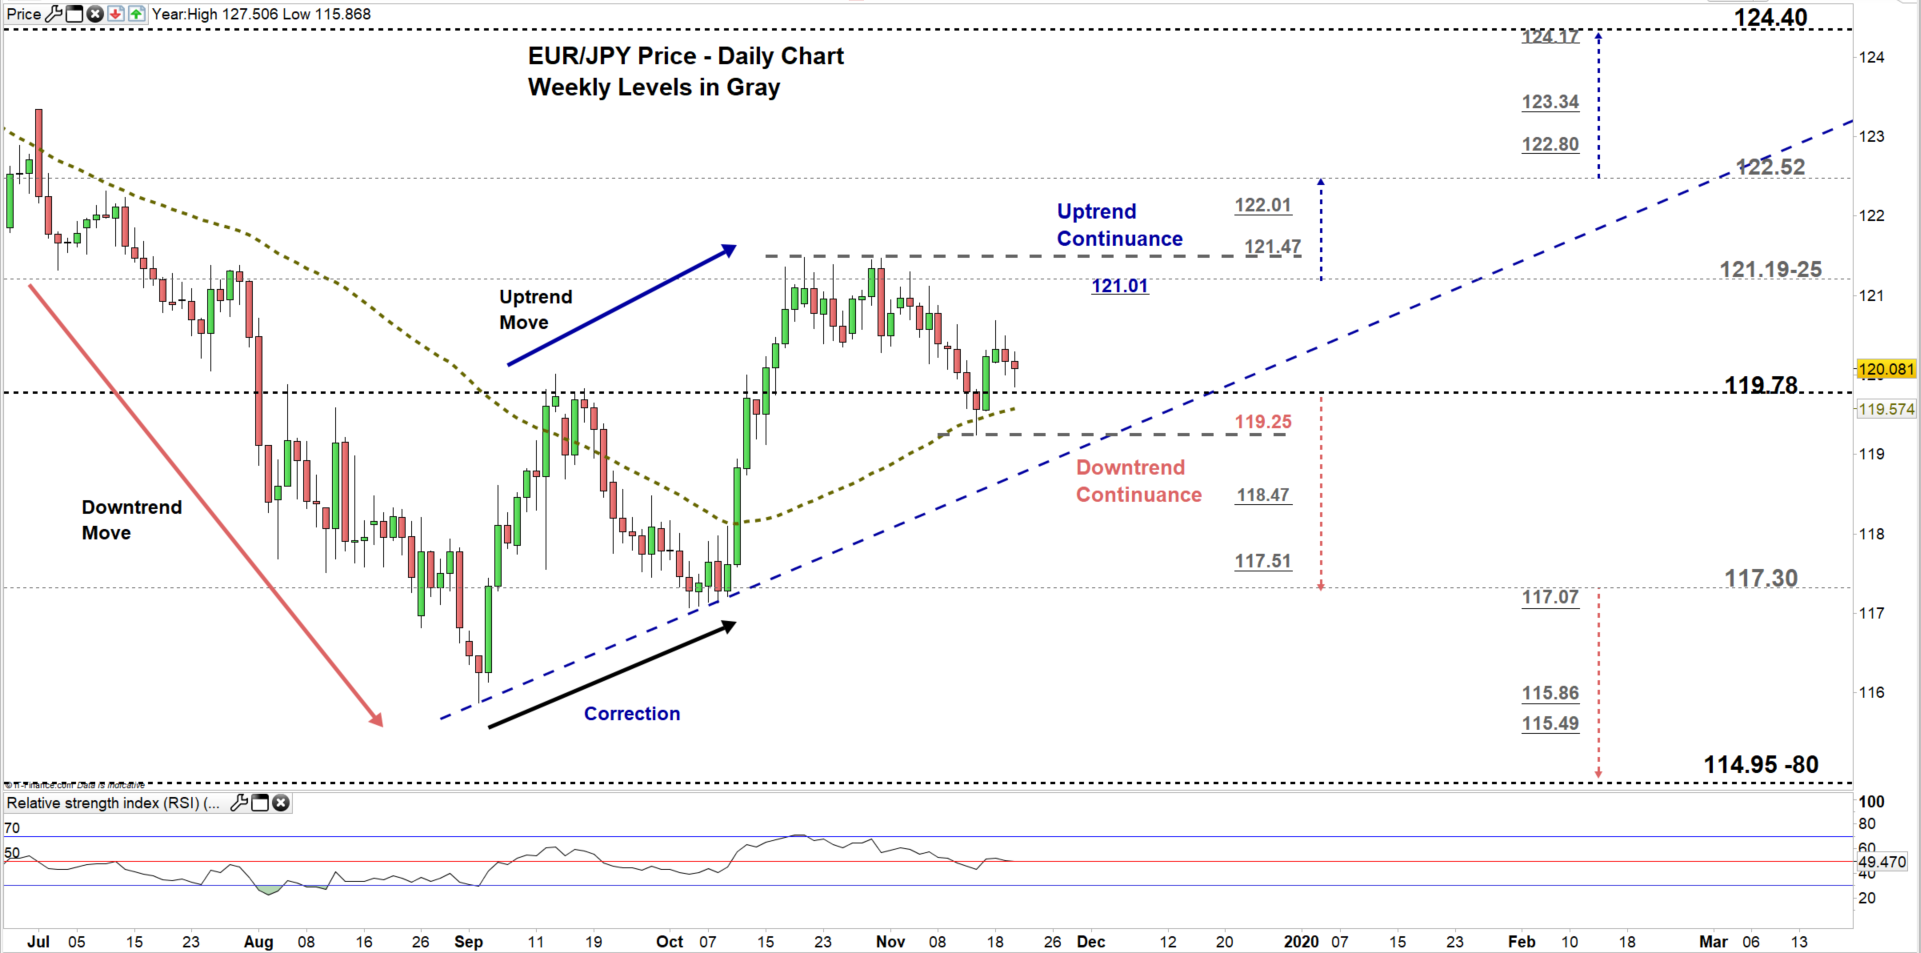
Looking at the daily chart, we notice on Thursday EUR/JPY closed above 50-day average, then rallied in the following day to a higher trading zone 119.78- 121.19. However, this week, buyers pulled back from 120.68 causing a fall towards the low end of the zone.
A close below the low end could generate a bearish signal, may convince some sellers to send EURJPY towards 117.30. A break below the Nov 14 low at 119.25 could entice more sellers to join in pressing the price. Nevertheless, the weekly support levels underlined on the chart (zoomed in) should be considered.
In turn, any failure in closing below the low end of the zone means some buyers keeping their positions. This could cause EURJPY to push towards the vicinity of 121.19-25. Further close above 121.25 may embolden more buyers to join in rallying the price towards 122.52 specially, if the pair breaks above 121.47. In that scenario, the daily and weekly resistance levels underscored on the chart should be watched closely.
Just getting started? See our Beginners’ Guide for FX traders
GBP/JPY Daily PRice CHART (Nov 20, 2017– Nov 20, 2019) Zoomed Out

GBP/JPY Daily PRice CHART (May 8 – Nov 20, 2019) Zoomed In

From the daily chart, yesterday GBP/JPY declined towards the lower trading zone 139.00 – 140.50. This negated the bullish pennate pattern as discussed in our last update and increased the likelihood for the price to press lower.
Its worth noting that, a double top pattern is currently developing where the neckline resides at 138.83. This suggests, if the price breaks and remains below the neckline it could see GBP/JPY trading towards 136.28. Although, the weekly support levels should be kept in focus.
On the other hand, any close above the high end of the zone could revive the potential for buyers to resume bullish price action towards the vicinity of 143.09-19. Although, the daily and weekly reissuance levels and area marked on the chart should be monitored.
Join Me on Friday, Nov 22 at 14:00 GMT. In this session we will talk about most common Continuation patterns and how to trade them.
Written By: Mahmoud Alkudsi
Please feel free to contact me on Twitter: @Malkudsi


