


GBP/JPY Price Outlook, Charts and Analysis
- Japanese Yen looking ahead to important data releases tonight, including CPI.
- GBP/JPY downward trend showing weakness.
Find out more about what is likely to move market prices through mid-year, and download for free Q2 GBP and JPY forecasts
To learn more about data releases for this week check out DailyFX Economic Calendar
GBP/JPY – Bears losing power
On May 23 GBP/JPY moved to the lower trading range (139.00 – 137.84) after closing below 139.00. The price showed more weakness and failed in the following days to close above the higher end of the mentioned trading range.
On May 29 the pair declined to the level mentioned in last week’s article, 137.95, and continued its fall to print 137.87 - its lowest level in four and a half months. However, the price pulled back in the same day closing with a Bullish Doji pattern.
Read More: Bearish momentum continues as Brexit turmoil weighs
Alongside this development, the relative strength indicator (RSI) remained below 30, in oversold territory. However, the price fell to a new low on Wednesday, while the oscillator failed to reach a new low, indicating the start of a bullish divergence and a weakening of the bearish momentum.
Just getting started? See our Beginners’ Guide for FX traders
GBP/JPY DAILY PRICE CHART (JAN 2, 2019- MAy 30, 2019)

A closer look at the GBP/JPY daily chart shows bears hesitating before pushing the price lower. If the price closes on Thursday above 139.00, this would be considered a bullish close, moving the price to a higher trading range (139.00- 140.50). This could result in a price rally towards the higher end of the mentioned trading range. Weekly and daily resistance levels at 139.50, 139.86 and 140.20 need to be watched closely.
A close below 137.84 would mean more weakness for GBP/JPY and move the price to a lower trading range (136.40 – 137.84). This could lead to a fall towards the lower end of the new trading range at 136.40. Weekly and daily support levels at 137.62, 137.36, 137.10 and 136.82 are worth monitoring.
Having trouble with your trading strategy? Here’s the #1 Mistake That Traders Make
GBP/JPY Two-HOUR PRICE CHART (May 16 –30, 2019)
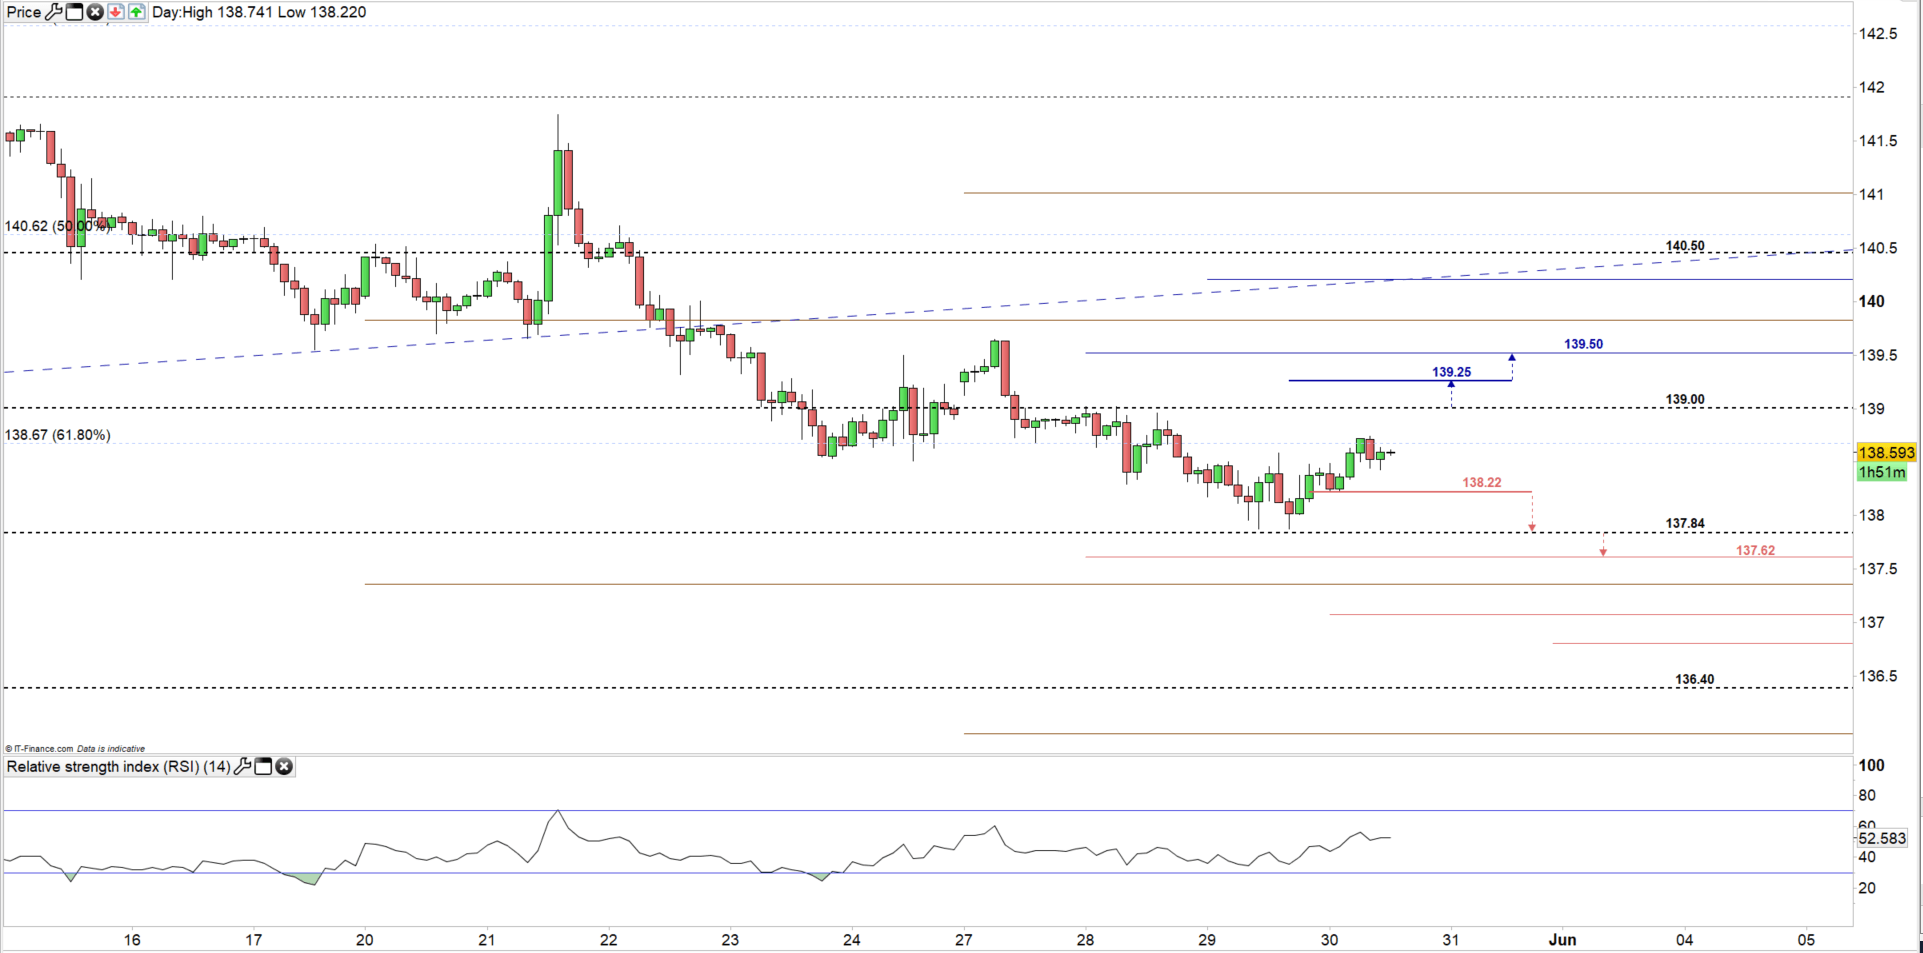
Looking at the GBP/JPY two-hour chart, the price rebounded Thursday from 138.22 twice. Therefore, any break below this threshold suggests the price might swing lower towards the lower end of the current trading range at 137.84. The 138.00 level would provide psychological support.
A break to the higher end of the current trading range at 139.00 could cause the price to rally towards the daily resistance mentioned above. However, resistance at 139.25 needs to be in focus.
Written By: Mahmoud Alkudsi
Please feel free to contact me on Twitter: @Malkudsi


