


Talking Points:
- GBP/JPY has started to show volatility again after an uncharacteristically quiet 2017 continued into the early portion of this year. After an aggressive reversal showed in February brought on recovery in March, the pair has remained on the move so far in April.
- GBP/JPY put in an aggressive reversal around last week’s UK inflation numbers, and this has sent prices back below the post-Brexit trend-line. Support came-in around the ‘s3’ level that we looked at last week, and now we have a shorter-term trend-line helping to hold the lows. We look at both trend-lines below.
- Quarterly Forecasts have just been updated, and Q2 forecasts are now available from the DailyFX Trading Guides Page. If you’re looking to improve your trading approach, check out Traits of Successful Traders. And if you’re looking for an introductory primer to the Forex market, check out our New to FX Guide.
To receive James Stanley’s Analysis directly via email, please sign up here
The Post-Brexit Trend-line Remains In-Play
Last week saw a vicious reversal show-up in GBP/JPY after the one-two combo of UK inflation and more dovish commentary from BoE Governor, Mark Carney. As we came into last week, GBP/JPY was riding high on a bullish trend that saw prices re-engage above the post-Brexit trend-line. This is a trend-line taken from the October, 2016 ‘flash crash’ low up to the August 2017 low. This trend-line projection offered multiple support hits in February, but soon became resistance in March when prices scaled-below.
Even when the pair recovered from the February sell-off, price action rubbed along the under-side of this trend-line for two weeks before a bullish breakout in April saw prices move back-above. But even that has been short-lived, as last week’s bearish reversal has sent prices right back-below that post-Brexit trend-line.
GBP/JPY Daily Chart: Back-Below the Post-Brexit Trend-Line
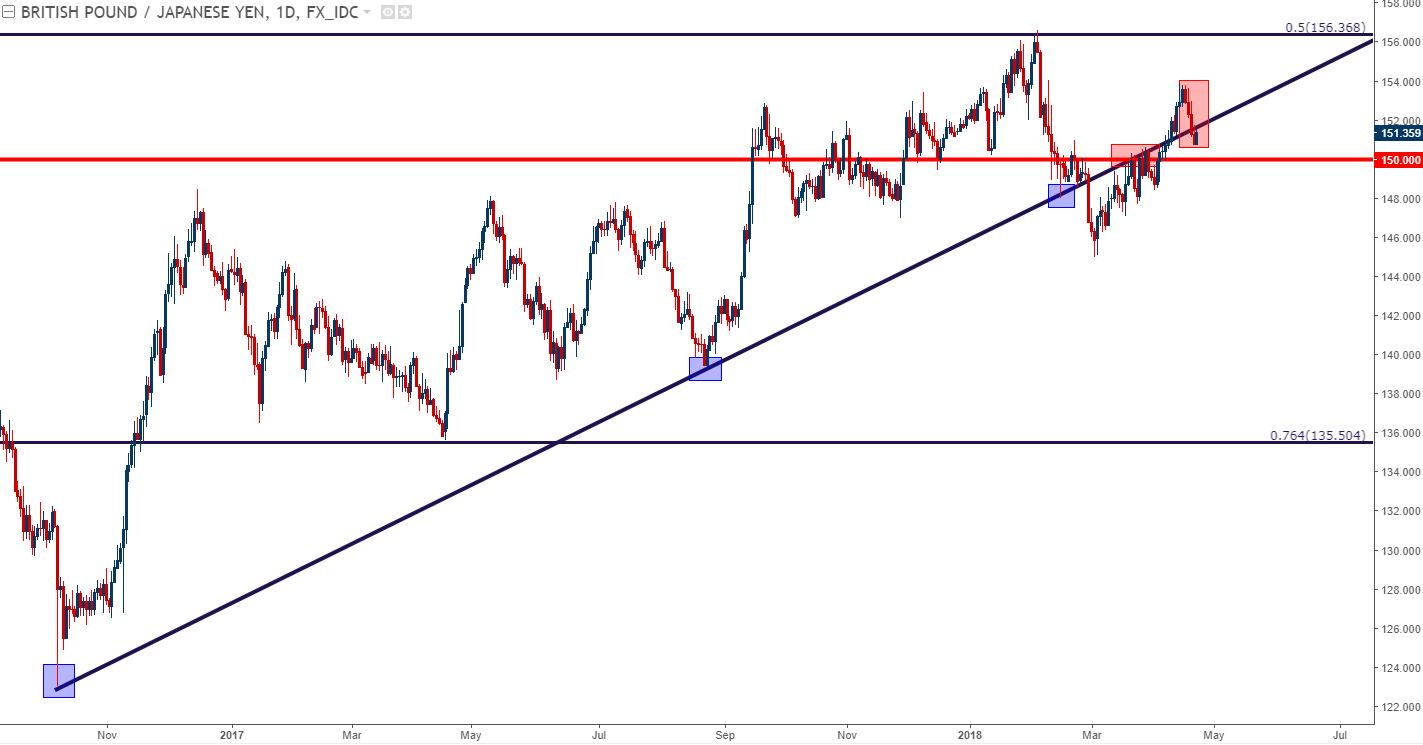
Chart prepared by James Stanley
After last week’s read of UK inflation for the month of March, prices posed a quick reversal of that prior bullish theme. Shortly after the release of inflation numbers, we published an article on GBP/JPY entitled, GBP/JPY: Support at Prior Fibonacci Resistance, But Will it Hold? The answer to that question was a definitive ‘no,’ and we’ve since seen prices scale-down to the next level of relevance at the 50% retracement of that same move. This level is at 150.80, and this is a confluent level as we also have a shorter-term trend-line in this area, taken from the March-April lows.
GBP/JPY Eight-Hour Chart: Confluence of Support at 50% Marker, Trend-Line

Chart prepared by James Stanley
Trend-Line Tango in GBP/JPY
At this stage, we have two bullish trend-lines from various time frames in GBP/JPY price action. The longer-term, post-Brexit trend-line is currently acting as intra-day resistance while the shorter-term bullish trend-line is continuing to provide support.
GBP/JPY Four-Hour Chart: Two Trend-Lines Remain In-Play in GBP/JPY

Chart prepared by James Stanley
Moving Forward
Given that we have a bearish item on the longer-term trend-line, taken from the break-below combined with intra-day resistance; combined with the shorter-term bullish item of prices holding support at the 50% retracement that’s confluent with that shorter-term trend-line, and there is a case that can be made on either side of GBP/JPY as we move into this week.
For traders with longer-term stances, waiting for the current impasse to first break could offer directional clues as to next steps. A break above 152.00 can re-open the door for longer-term bullish strategies, while a break below 150.00 begins to open the door for longer-term bearish approaches.
On a shorter-term basis, the more interesting item would appear to be bullish in nature; looking to trade a reversal of last week’s bearish drive in the pair as we near a Bank of Japan rate decision later in the week. The area of support around 150.80 was the ‘s3’ level from our article last Wednesday, and the same themes that we discussed there remain as attractive.
From the hourly chart below, we can see where prices have re-engaged above another Fibonacci level, this one at 151.39, serving as the 76.4% retracement of the Brexit-move in the pair, and this keeps the door open for a continuation of short-term higher-highs and higher-lows, anticipating a top-side break back-above the post-Brexit trend-line.
GBP/JPY Hourly Chart: Attempting to Carve Out a Bottom
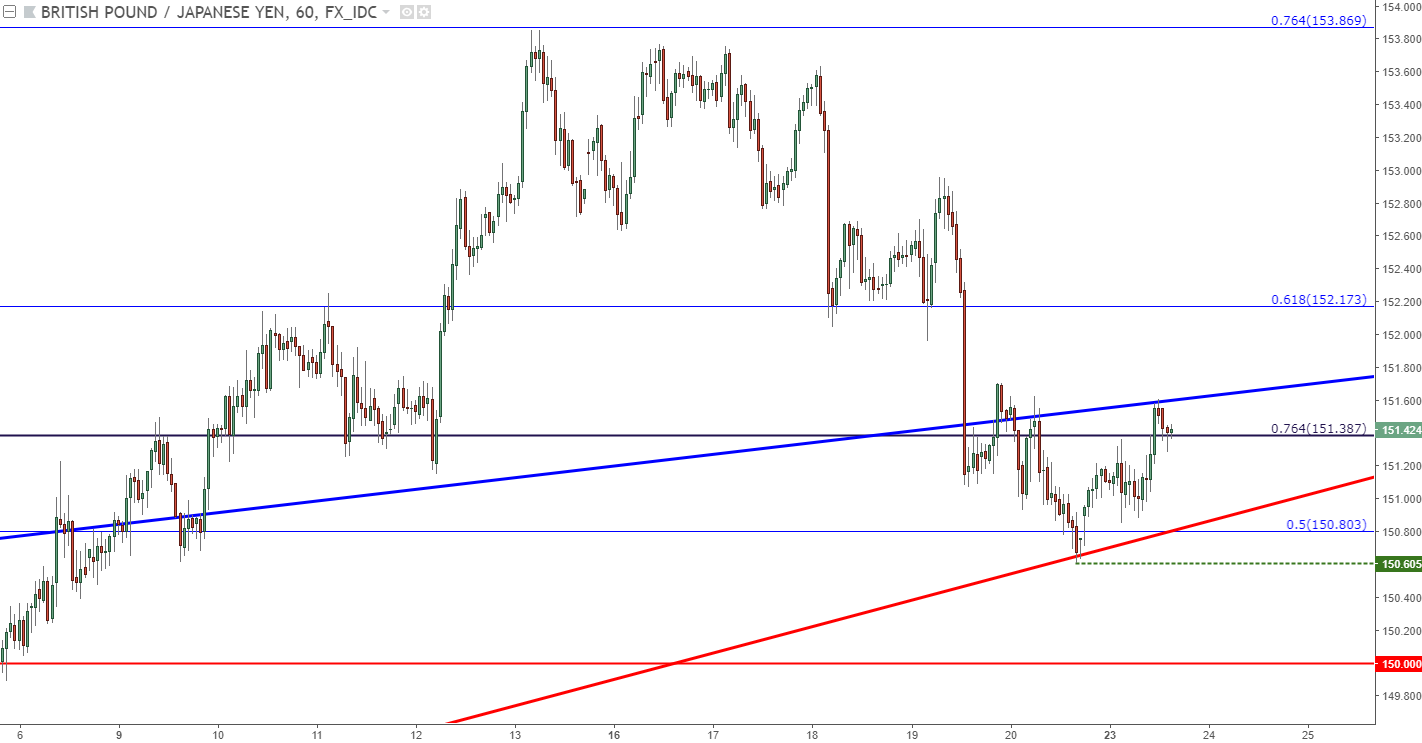
Chart prepared by James Stanley
To read more:
Are you looking for longer-term analysis on GBP and/or JPY? Our DailyFX Forecasts for Q1 have a section specifically for each currency. We also offer a plethora of resources on our GBP/JPY page, and traders can stay up with near-term positioning in GBP/USD and USD/JPY via our IG Client Sentiment Indicator.
--- Written by James Stanley, Strategist for DailyFX.com
To receive James Stanley’s analysis directly via email, please SIGN UP HERE
Contact and follow James on Twitter: @JStanleyFX


