


Talking Points:
- GBP/JPY has just set a fresh two-month high after finding a bit of resistance at the 76.4% Fibonacci retracement of the ‘Brexit move’ in the pair.
- GBP/JPY has put in strength so far in April, continuing the March advance after the February sell-off. The door remains open for topside as the pair continues to show signs of recovery after the aggressive sell-off that showed earlier in Q1.
- Are you looking to improve your trading approach? Check out Traits of Successful Traders. And if you’re looking for an introductory primer to the Forex market, check out our New to FX Guide.
If you’re looking for longer-term analysis on GBP, JPY or the US Stocks, click here for our Trading Forecasts.
GBP/JPY Recovery Continues
GBP/JPY continues to show signs of recovery from the February sell-off when the pair shed more than 1,000 pips in less than a month. Support showed-up around the 145.00 psychological level on the second trading day of March , and after spending the rest of the month gyrating-higher, the pair has rallied into the 76.4% Fibonacci retracement of the Brexit-move in the pair.
GBP/JPY Daily Chart: Rally to 76.4% Fibonacci Resistance of the Brexit Move
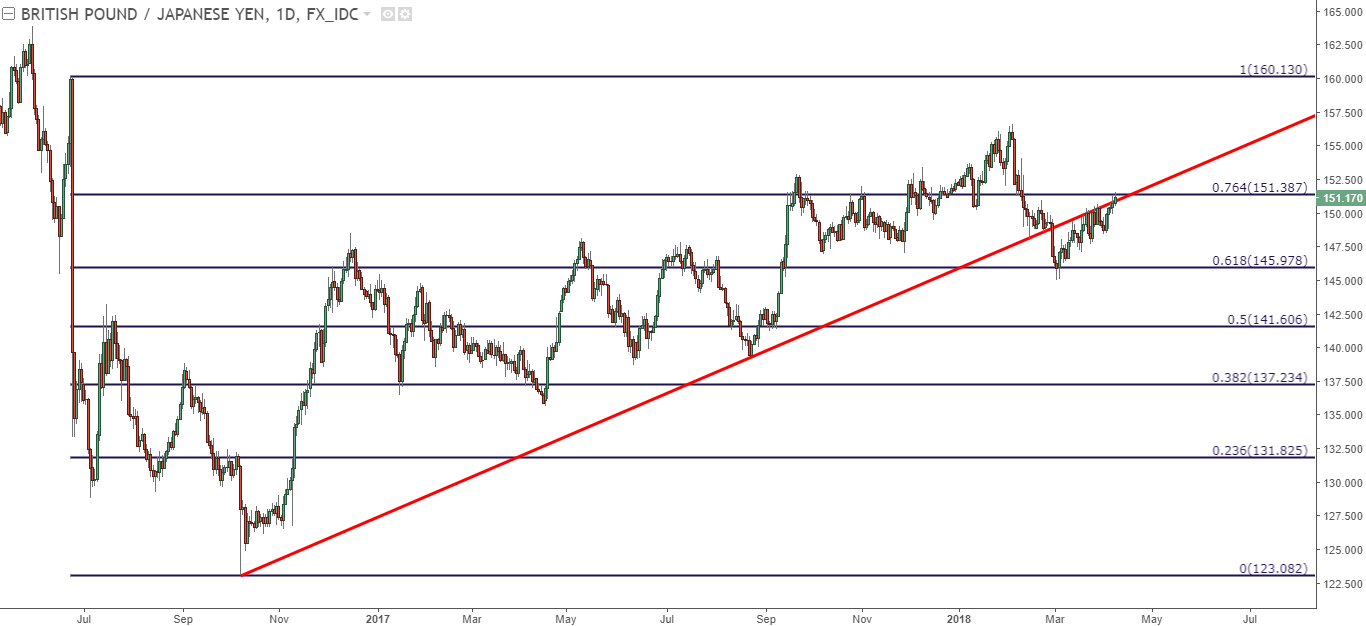
Chart prepared by James Stanley
Going along with this bullish advance has been a break back-above the post-Brexit trend-line, and this had helped to offer multiple points of resistance in the month of March. In our last article, we looked at the premise of topside breaks back-above the 150.00 level to open the door for bullish exposure, and we took this a step further by focusing-in on the level of 150.80. This is the 50% retracement of the February sell-off in the pair, and at this point, this area can help to mark a zone with which bulls can look to for higher-low support.
GBP/JPY Four-Hour Chart: Higher-Low Support Potential Above 150.00
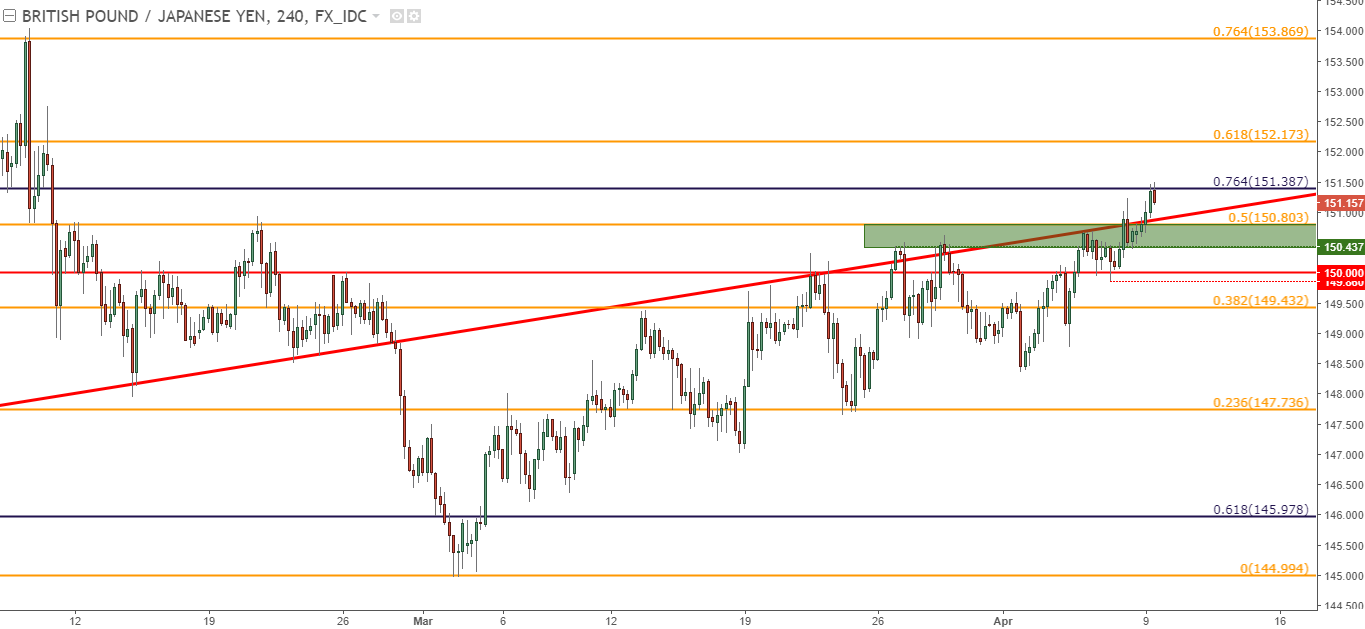
Chart prepared by James Stanley
On the hourly chart below, we’re incorporating a group of swing highs from late-March to help produce a support zone above the 150.00 psychological level. Price action finding support in this zone opens the door for topside exposure, targeting towards the 152.50 psychological level.
GBP/JPY Hourly Chart: Fibonacci Resistance Stalls Advance

Chart prepared by James Stanley
To read more:
Are you looking for longer-term analysis on GBP and/or JPY? Our DailyFX Forecasts for Q1 have a section specifically for each currency. We also offer a plethora of resources on our GBP/JPY page, and traders can stay up with near-term positioning in GBP/USD and USD/JPY via our IG Client Sentiment Indicator.
--- Written by James Stanley, Strategist for DailyFX.com
To receive James Stanley’s analysis directly via email, please SIGN UP HERE
Contact and follow James on Twitter: @JStanleyFX


