


Talking points
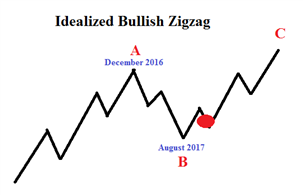
-GBP/JPY appears to be in the ‘c’ wave of a bullish zigzag pattern
-Though a dip to 146 cannot be ruled out, longer-term pattern targets 163
-A break down below the trend channel suggests the zigzag may have already ended
New to trading FX? We created this guide just for you.
The longer-term view of GBP/JPY is that the trend is higher in a bullish zigzag. We appear to be more than halfway through the zigzag as we are in the ‘c’ wave of the a-b-c move.
The ‘b’ wave of the zigzag is counting as a triangle pattern. Therefore, we are anticipating a five-wave motive wave bursting higher from the August 2017 low. It appears we have the first of those five waves in place, labeled (i) and GBP/JPY is correcting sideways in a wave (ii).
It is possible to count wave (ii) as ending at the November 27 low and if so, then wave (iii) is working higher on a breakout above 154. We cannot rule out the possibility of wave (ii) continuing to grind sideways with a dip to 147.50 acting as a washout of long traders. Eventually, we think the blue channel support line will hold GBP/JPY prices should a dip begin.
We can count an impulsive wave from August 2017 to September 21 high of 152.86. That high came close to the .618 wave relationship so it is possible the bullish wave is over, though we think that is lower probability. The price action since September 21 is printing in corrective waveform that hints at more gains over the long run.
Bottom line, we think GBP/JPY will work higher towards 163 in the coming months. A dip to 147.50 would fit within the context of a typical wave (ii). A significant break of the channel support line would hint at a deeper correction down towards 140 and possibly even 130.
Interested to learn more regarding Elliott Wave Theory? Grab the Beginner and Advanced Elliott Wave guides and follow the patterns we discussed for GBP/JPY.
Discuss this pattern and other longer term Elliott Wave patterns in Jeremy’s “What to Watch For in 2018” webinar. (If you cannot make it in real time, register to receive the recording via email.)
Why do a majority of traders lose? Find out in our traits of successful traders research.
Longer Term GBP/JPY Elliott Wave Analysis

---Written by Jeremy Wagner, CEWA-M
Jeremy is a Certified Elliott Wave analyst with a Master’s designation. This report is intended to help break down the patterns according to Elliott Wave theory.
Follow on twitter @JWagnerFXTrader .
Join Jeremy’s distribution list.
Recent Elliott Wave articles by Jeremy:
USD/CAD Falls Towards Support Offering a Bullish Setup
Elliott Wave Analysis: Crude Oil Price Bursts Higher in 5th Wave
Santa Brings a Gold Price Rally for Christmas
EURUSD Elliott Wave Pattern Looks to Higher Levels
NZDUSD Elliott Wave Analysis: Fourth Wave Close to Terminating


