


Talking Points:
- GBP/JPY surged after bouncing from a recent double-bottom formation; but just a week later, resistance came-in at the September swing-high leading to a double-top formation.
- The double-bottom is a cleaner formation, and this echoes the general bias of strength that’s been seen in the pair this year. We look at a couple of different ways of approaching bullish exposure in GBP/JPY.
- Want to see how GBP and JPY are holding up to the DailyFX Forecasts? Click here for full access.
To receive James Stanley’s Analysis directly via email, please sign up here
In our last article, we looked at GBP/JPY breaking above an area of prior resistance that showed around a key Fibonacci level. The price in question is 148.29, and this is the 61.8% retracement of June to December, 2016 major move in the pair. Perhaps most importantly, this price had helped to set resistance for almost ten full months in GBP/JPY. Prices turned-around here in mid-December, and again in May as GBP/JPY put in a peculiar period of price action. This pair is often trending or moving in somewhat of a directional manner: But it’s also notorious for being wild and chaotic. The fact that the first nine months of this year were so seemingly quiet in the pair is something that deserves attention, as we may be on the cusp of some brutal movement, in one direction or the other.
We have yet to see GBP/JPY embark on a directional movement since that initial September breakout. Price action has been bound between support of 146.94 and resistance of 152.86 for more than two-and-a-half months. This has created a pattern on either side of the move: A double-bottom is showing at support while a slightly less-intriguing (explained below) double-top remains at resistance:
GBP/JPY Daily: Range Bound since Mid-September – Double-Bottom Formation

Chart prepared by James Stanley
The reason that the double-bottom here would be a bit more intriguing than the double-top is the accompanying price action. While both the double-bottom and top share similar levels of reversal in their respective formations, the double-bottom had consistent build of price action both higher-and-lower as each leg of the formation was setting. The tops, meanwhile, came-in rather violently, with quick reversal reactions at each. Many chartists will consider the high around 152.00 between those two points of support as the ‘peak’ of the double bottom formation; and the double-top simply has nothing comparable. And while this wouldn’t necessarily preclude these levels as usable, it does denote a general overall bullish bias that remains in GBP/JPY after this year’s move-higher.
What this means: Traders will likely want to be careful with short-side exposure with the current back-drop. If we do get a breach of support at the double-bottom, the door can be opened for bearish breakouts. But until then, the short-side of GBP/JPY should be approached with caution.
The long-side, however, could be a bit more interesting. One way of moving forward can simply be waiting for support to test around that same area of the prior double bottom. Stops can be set below the low and if buyers do return to push prices back towards resistance, a fairly attractive risk-reward ratio could be seen. The down-side to this approach is that we’re currently more than 300 pips away from that support level; so this is a bit divorced from our current context.
One possibility would be to look for support to build around the psychological level of 150.00. This would still be fairly early as price action posed a fairly aggressive reversal shortly after the open of this week’s trading, and we just began to re-engage this level earlier this morning. So, we can’t quite call this near-term support yet and there’s a chance that this potential setup flakes out before it becomes usable. But – if this does confirm, the door can be opened to aggressive bullish stances in GBP/JPY, targeting the prior swing-high around ¥151.75 before an eventual return towards resistance of ¥152.50.
GBP/JPY Four-Hour: Near-Term Support Potential

Chart prepared by James Stanley
Trading Support in GBP/JPY
To confirm support, traders can wait for prices to start moving higher; indicating that the near-term sell-off may be done. We’ve seen a bit of cessation at the lows, but we have yet to see bulls starting to take over, as the hourly still shows a ‘lower-high’ around 150.40. The simple act of price action taking out this level can denote that support may be stable enough to act upon, enabling stops below the ‘peak low’ of this recent bearish run. This shorter-term approach with tighter stops can afford the possibility of more near-by profit targets, such as prior areas of relevance around 151.15, 151.75, or 152.50.
If higher-low support doesn’t hold, if a near-term higher-high does not print – this aggressive approach would be invalidated and, instead, focus should be paid towards the longer-term setup.
GBP/JPY Hourly: Early Signs of Support ~ ¥150.00
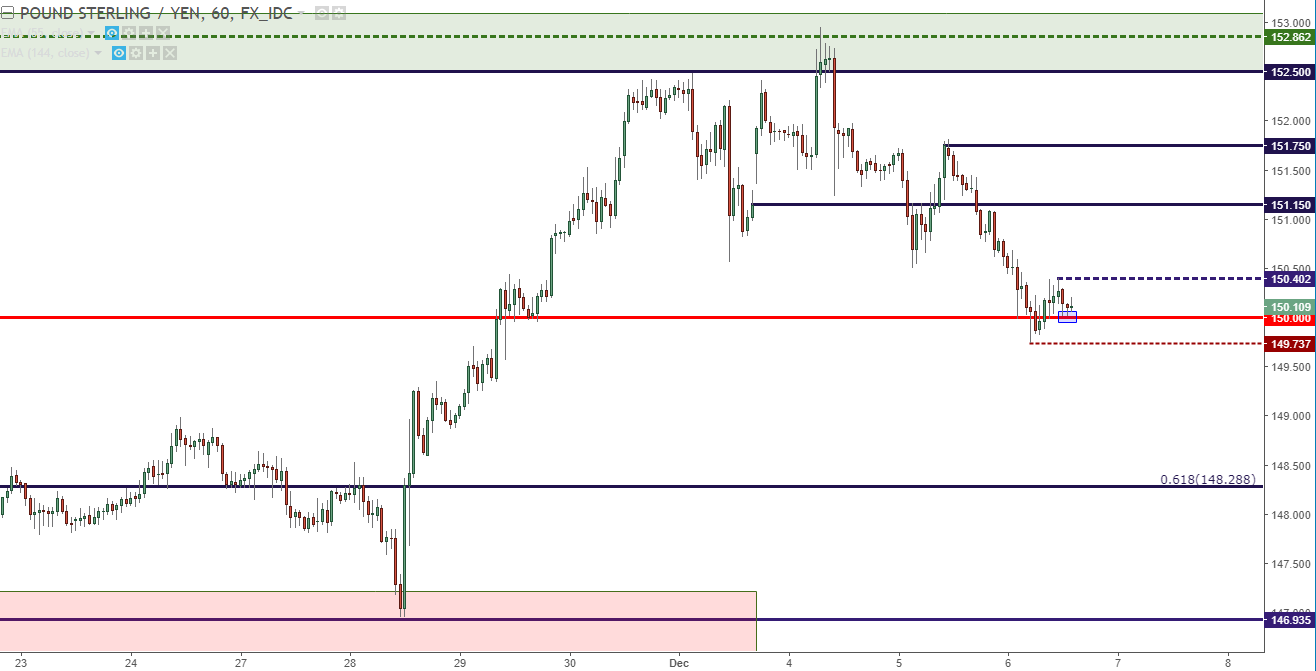
Chart prepared by James Stanley
--- Written by James Stanley, Strategist for DailyFX.com
To receive James Stanley’s analysis directly via email, please SIGN UP HERE
Contact and follow James on Twitter: @JStanleyFX


