


To receive James Stanley’s Analysis directly via email, please sign up here.
Talking Points:
- GBP/JPY Technical Strategy: Intermediate-term: Congested, short-term: Expansionary pattern (megaphone).
- GBP/JPY finally broke out of the month-old wedge, but sellers were unable to create significant drive sub-139.00.
- If you’re looking for trading ideas, check out our Trading Guides. And if you’re looking for ideas that are more short-term in nature, please check out our Speculative Sentiment Index (SSI) Indicator.
In our last article, we looked at the continued congestion in GBP/JPY as the pair moved deeper-and-deeper into a symmetrical wedge pattern. For a pair that is traditionally a volatile fast-mover, such congestion can come-in as daunting to price action traders. Because when that wedge inevitably breaks, there could be significant follow-thru as a build of buyers or sellers could take over after the wedge yields.
That did not happen here. After we warned of persistent resistance in GBP/JPY two weeks ago, bears continued to drive prices-lower, eventually breaking below the under-side of the wedge pattern. And sellers were even able to continue driving-lower, albeit temporarily, as the psychological level at ¥140.00 came into play. Just yesterday morning, we saw another lower-low print but, again, this was met with considerable buying pressure shortly thereafter; making the bearish side of GBP/JPY look considerably less-attractive after the bottom-side break of the wedge.

Chart prepared by James Stanley
Shorter-term, what we have here is a ‘megaphone’ pattern, accented by price action putting in both higher-highs and lower-lows:
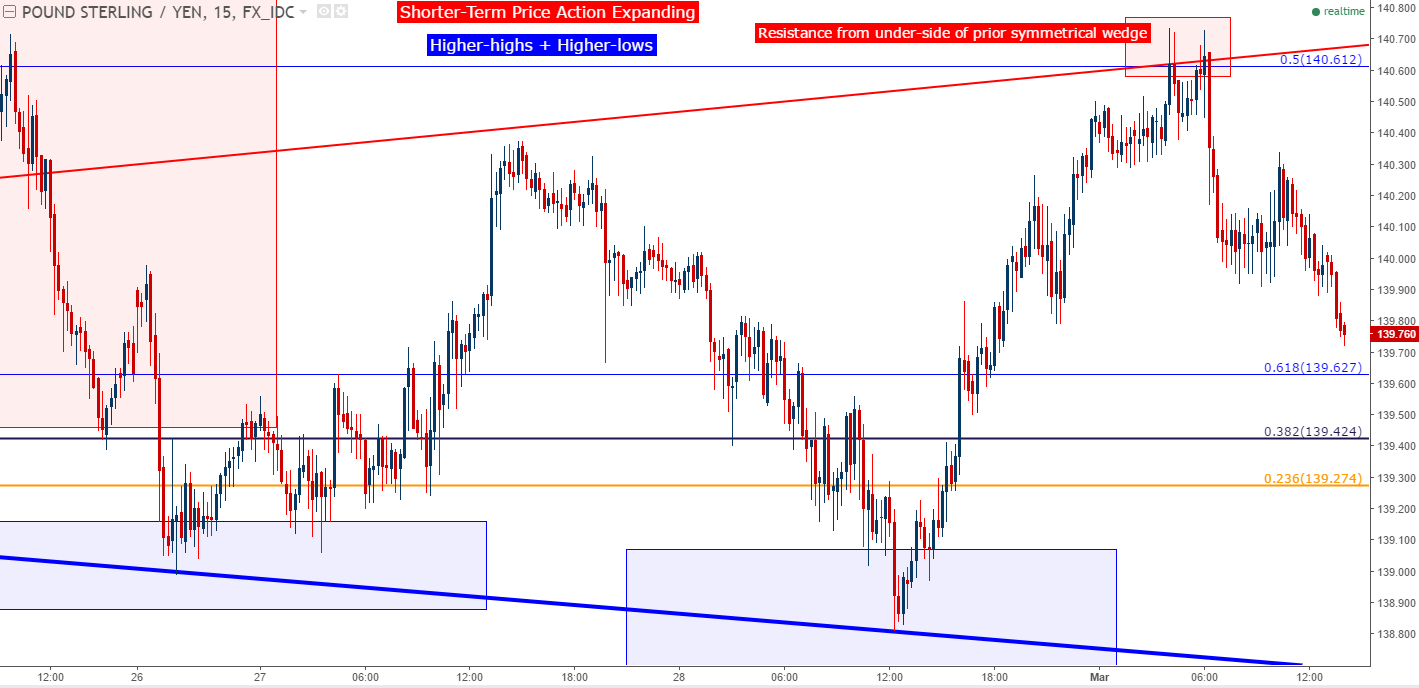
Chart prepared by James Stanley
To trade the megaphone, we can look for a break above the previous level of resistance at 140.61 to denote top-side continuation potential. Given the failure of bears to significantly drive price action-lower after the symmetrical wedge broke, we may be seeing a situation in which sellers are beginning to dry-up on a longer-term basis, so the top-side of the pair could be favored despite this seemingly direction-less series of patterns. Also contributing to the interest around this level at 140.61 is the fact that the prior resistance swing took place at the under-side of the prior symmetrical wedge; so if we get price action running above this level, we’ll not only have higher-highs, but a top-side resistance trend-line break.
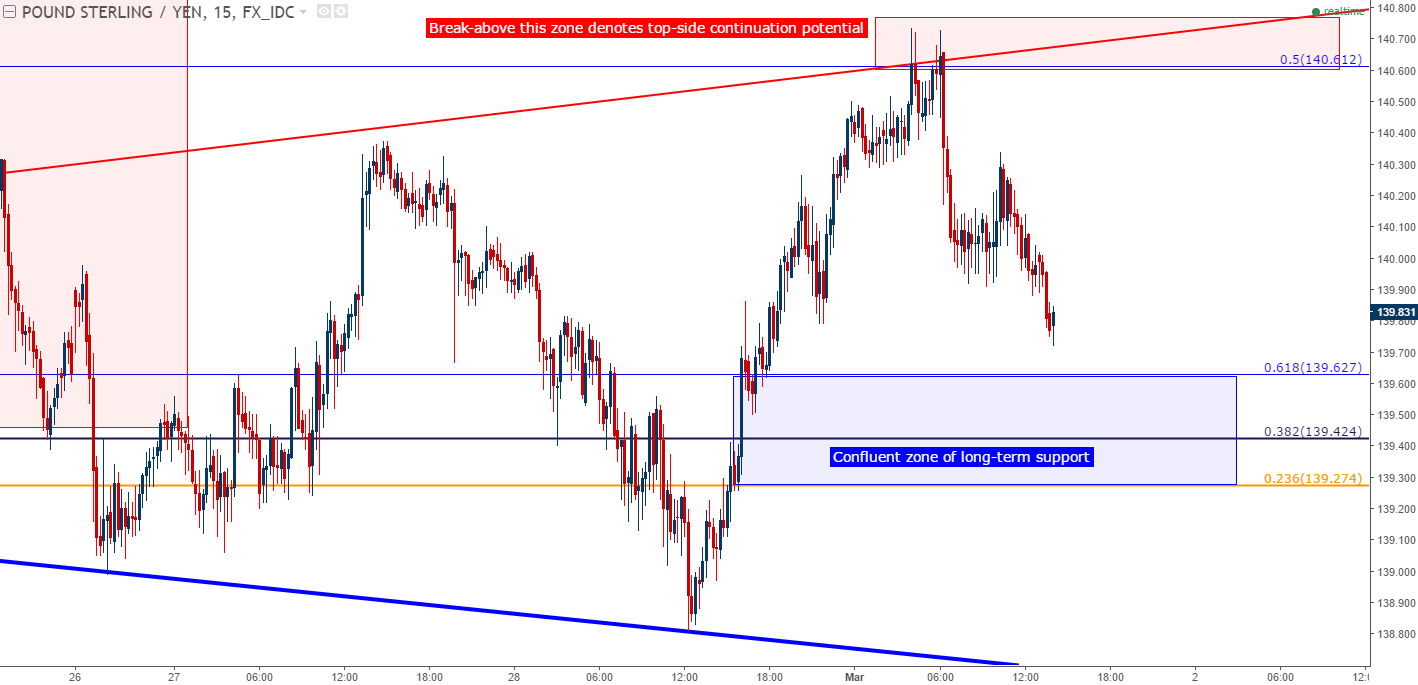
Chart prepared by James Stanley
Alternatively, on the underside of current price action is a 35-pip zone of potential support, running from ¥139.27 up to ¥139.63. This zone has seen prior breaches below, so this should still be handled delicately; but should buyers show up to support another visit to this zone, top-side setups could be sought with relatively tight stops, targeting that same level of resistance at 140.61.
--- Written by James Stanley, Analyst for DailyFX.com
To receive James Stanley’s analysis directly via email, please SIGN UP HERE
Contact and follow James on Twitter: @JStanleyFX


