


To receive James Stanley’s Analysis directly via email, please sign up here.
Talking Points:
- GBP/JPY Technical Strategy: Intermediate-term: Congested, symmetrical wedge building.
- GBP/JPY reacted off of the key resistance zone around ¥142.50, but support showed shortly thereafter, highlighting the diminishing range currently showing in GBP/JPY.
- If you’re looking for trading ideas, check out our Trading Guides. And if you’re looking for ideas that are more short-term in nature, please check out our Speculative Sentiment Index (SSI) Indicator.
In our last article, we looked at a persistent batch of confluent resistance in GBP/JPY around the ¥142.50 psychological level. This led into a bearish batch of price action that brought prices back below the ¥140-handle, albeit briefly, until bulls returned to volley prices-higher. The net of this diminishing range has been further build inside of a symmetrical wedge pattern (shown below):
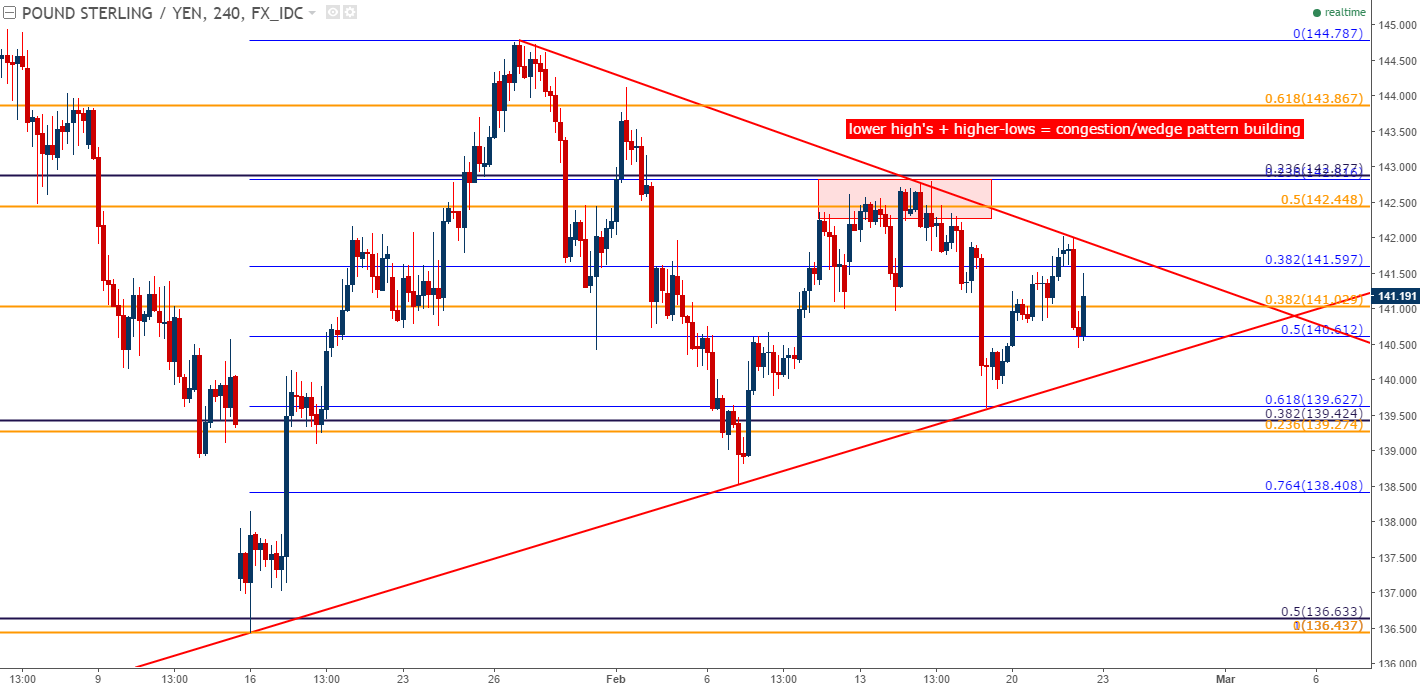
Chart prepared by James Stanley
Moving forward, traders can look for a break of the wedge to indicate the next directional move. A top-side break above trend-line resistance could open the door for bullish continuation strategies; while a break below support could signal the potential for bearish price action. On the chart below, we identify barriers that could be used on either side of recent GBP/JPY price action to institute such an approach. On resistance, we’re looking at the same zone of confluent resistance from our last article around ¥142.50, and on the support size we’re looking just below the ¥140-psychological level.

Chart prepared by James Stanley
--- Written by James Stanley, Analyst for DailyFX.com
To receive James Stanley’s analysis directly via email, please SIGN UP HERE
Contact and follow James on Twitter: @JStanleyFX


