


Talking Points:
- EUR/USD and CAC 40 Open Week Lower Ahead of ECB
- EUR European Central Bank Rate Decision (JUN 08) expected at 0.00%
- What’s next for currency and equities markets? Learn more with our market forecasts
The EUR/USD and CAC 40 are turning lower for Monday, as traders await this week’s European Central Bank rate decision on June the 8th. Expectations for Thursday’s news are set to see interest rates kept at an effective 0.00%. However, traders of European markets should remember, any changes in monetary policy based off of new economic data may have the ability to affect markets.
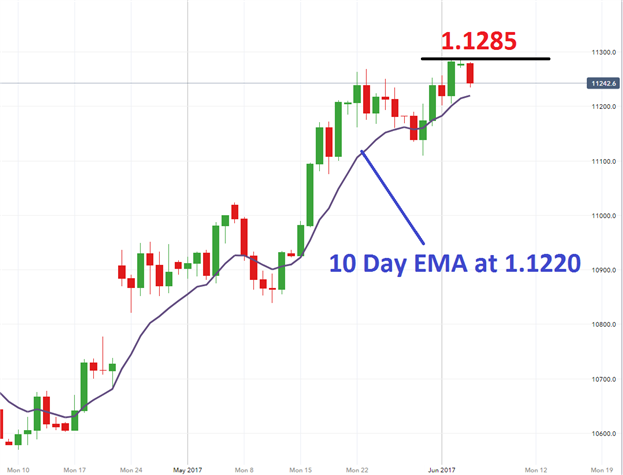
Technically the EUR/USD remains in an uptrend for Monday, despite the pair turning under its 2017 high of 1.1285. Traders should note that for today, the EUR/USD’s 10 day EMA (exponential moving average) is found at 1.1220. This line is currently acting as a value of support, and if prices bounce above this point traders may again look for the pair to press towards new highs. If prices continue to fall below this point, this would suggest that a short term downtrend is developing. In a bearish scenario, traders may begin to target the May 30th swing low at 1.1109.
EUR/USD, Daily Chart with 10 day EMA
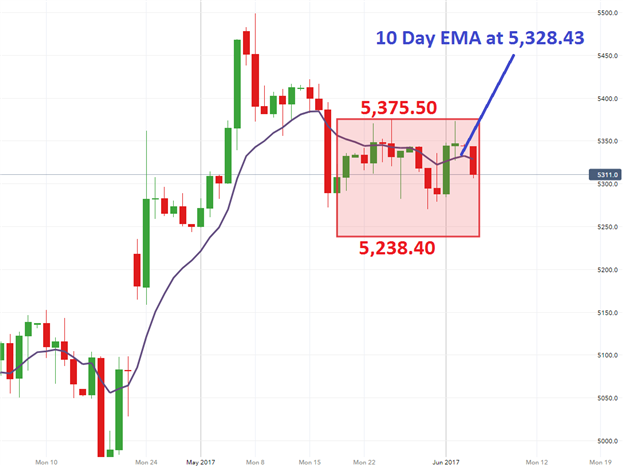
Technically the CAC 40 is turning lower after testing the top of an ongoing range on Friday. Resistance for the range may be found near 5,375.50, and with the Index turning lower traders may begin to look for a move back towards support at 5,238.40. Traders should finally note that the 10 day EMA for the CAC 40 is currently found at 5,328.43. If prices breakout lower this week on news from the ECB, this value will continue to be referenced as a point of resistance. Alternatively, if prices begin to breakout above 5,375.50, it may then be referenced as a value of support.
CAC 40, Daily Chart with 10 day EMA
--- Written by Walker, Analyst for DailyFX.com
To Receive Walkers’ analysis directly via email, please SIGN UP HERE
See Walker’s most recent articles at his Bio Page.
Contact and Follow Walker on Twitter @WEnglandFX.


