


Talking Points:
- CAC 40 Breaks Below Lower as European Shares Slide
- Next Daily Support is Found at 4,820.00
- Looking for additional trade ideas for equities markets? Read our 2017 Market Forecast
CAC 40 is currently trading off of its weekly lows, and is now down -.64% so far for Wednesday’s session. Today’s trading has seen European equities markets turn lower as a whole, as European Inflation data was released in line with expectations earlier in the day. Euro-Zone CPI (YoY) was expected and released at 1.1%. Winners for the CAC 40 include Pernod Ricard (+.95%) and ArcelorMittal (+.80%). Losers for the day include Cap Gemini (-2.31%) and BNP Paribas (-1.98%).
Technically, the CAC 40 is now trading below previous support found at 4,856.50. Today’s bearish breakout concludes 11 sessions of range bound activity for the Index. The next critical line of daily support for the CAC 40 falls at 4,820.00. This point has previously acted as a shelf of support, and a decline below this value would suggest that the Index is prepared to decline further. Alternatively if the CAC 40 remains supported here, the Index may rebound to retest the standing 2017 high at 4,929.60.
CAC 40, Daily Chart with Breakout
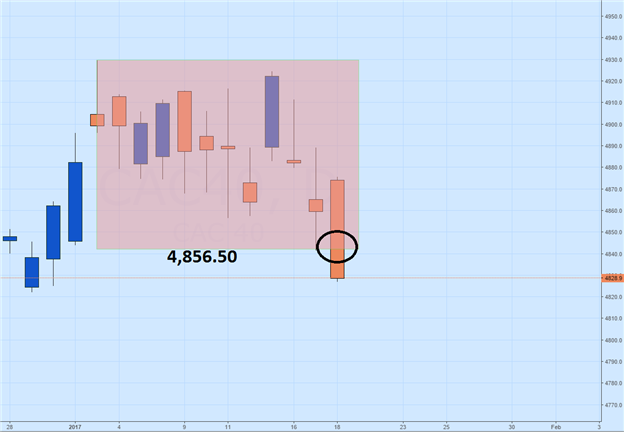
(Created Using TradingView Charts)
Intraday the CAC 40 is just beginning to breakout lower under today’s S4 pivot found at 4,833.70. If the Index remains below this point, it opens up the Index to move towards new lower lows. Initial bearish projections may be found near 4,807.1, by extrapolating a 1X extension of today’s 26.6 point range.
In the event that prices begin to rebound, it should be noted that previous values of support are now working as resistance intraday. A move beyond the S3 pivot at 4,846.30 would potentially invalidate this morning’s bearish breakout, and suggest a change in market conditions. In this scenario, traders may look for the CAC 40 to trade higher, reaching for other points of resistance including the R3 and R4 pivots found at 4872.6, and 4866,20 respectfully.
CAC 40, 30 Minute Chart with Pivots

(Created Using TradingView Charts)
--- Written by Walker, Analyst for DailyFX.com
To Receive Walkers’ analysis directly via email, please SIGN UP HERE
See Walker’s most recent articles at his Bio Page.
Contact and Follow Walker on Twitter @WEnglandFX.


