


Talking Points:
- CAC 40 Ends Week In Range
- Bullish Daily Breakouts Begin Above 4,929.60
- Looking for additional trade ideas for equities markets? Read our 2017 Market Forecast
CAC 40 consolidation has continued for the week, after putting in a new high on Tuesday at 4,929.60. So far for Friday’s session, the Index is trading down modestly (-0.17%) for today’s session. Top winners for the CAC 40 include Nokia (+1.68%) and Kering (+1.36%). Losers for the day include Sanofi (-2.71%) and Technip (-1.08)
Technically, the CAC 40 can be seen consolidating on the daily chart below. This 4-day range has been established by prices failing to breakout higher, which would signal a continuation of the Index’s multi month uptrend. Going into next week’s trading, traders should continue to look for a breakout above Tuesdays high. Alternatively, in the event that prices break under today’s low of 4,874.40, it may suggest that a new swing high has been put in place. In this scenario, traders may begin to look for the CAC 40 to retrace a portion of its December 2016 gains.
CAC 40, Daily Chart with Range
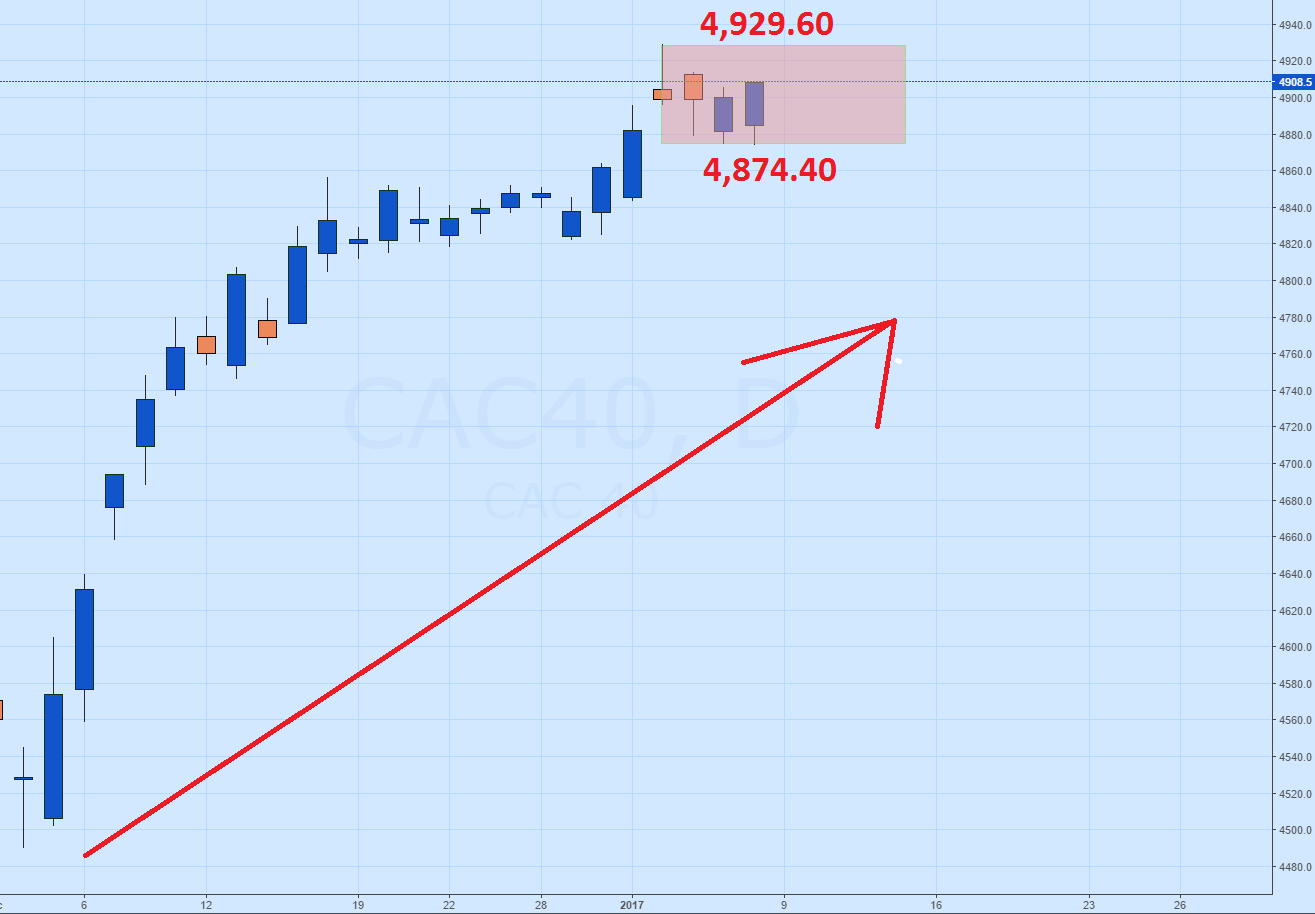
(Created Using TradingView Charts)
Looking for additional trade ideas for Oil and Commodities Markets? Read Our 2017 Market Forecast
Intraday the CAC 40 is also seen as range bound. At present, the Index is testing the upper boundary of range resistance found at today’s R3 pivot at 4,909.20. In the event that prices break through this point, next resistance is found at 4,917.70. A move through this point would symbolize the beginning of an intraday bullish breakout and open the CAC 40 to trading towards Tuesday’s high of 4,929.60.
If prices are rejected near present values, it may suggest that the Index may then retrace back towards values of support. For today’s trading, this includes the S3 pivot at 4,892.10 and the S4 pivot found at 4,883.50. Traders should note that prices have already attempted to breakout once below the S4 pivot this morning. In the event of another attempt, bearish traders may look for new lows to be established before today’s end of trading.
CAC 40, 30 Minute Chart with Pivots
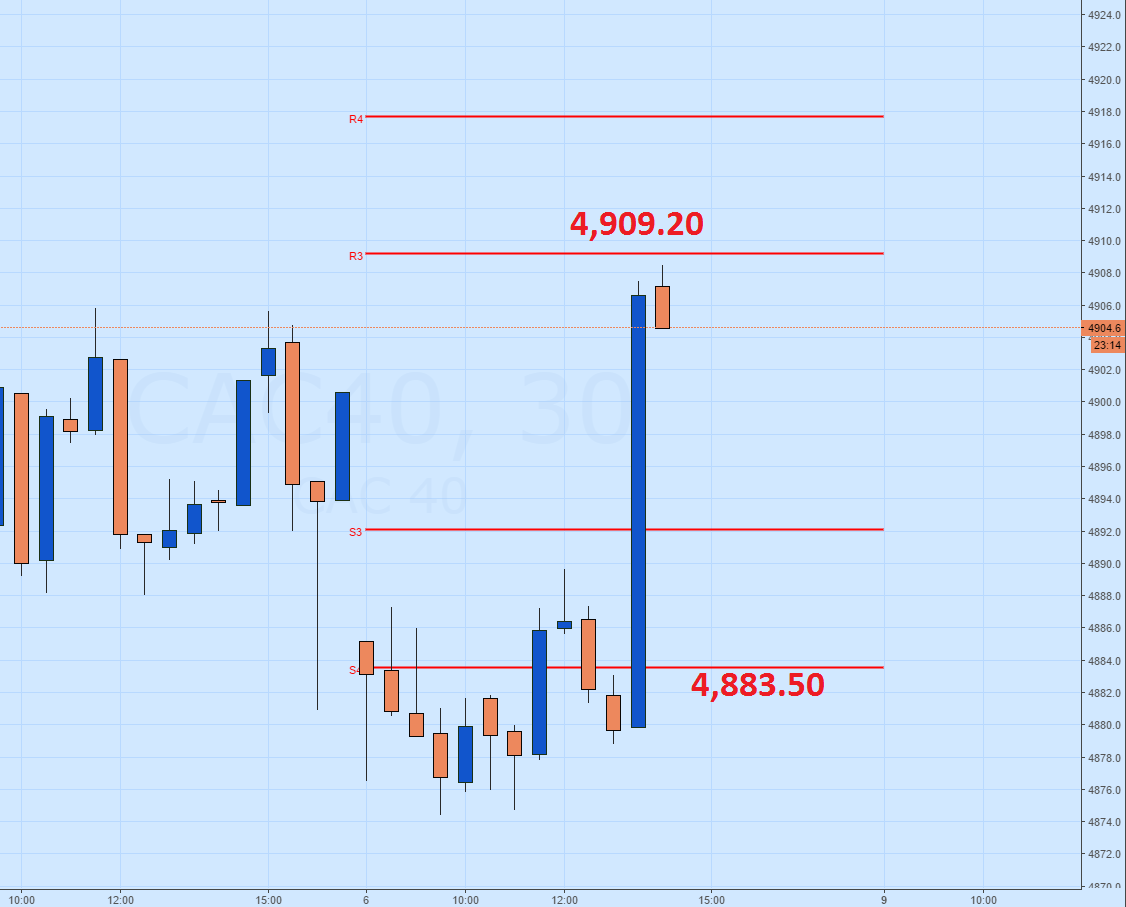
(Created Using TradingView Charts
--- Written by Walker, Analyst for DailyFX.com
To Receive Walkers’ analysis directly via email, please SIGN UP HERE
See Walker’s most recent articles at his Bio Page.
Contact and Follow Walker on Twitter @WEnglandFX.


