


Talking Points
- CAC 40 Closes Lower for 4th Session
- The 200 DAY SMA Resides at 4,414.50
- If you are looking for more trading ideas for equities markets, check out our Trading Guides
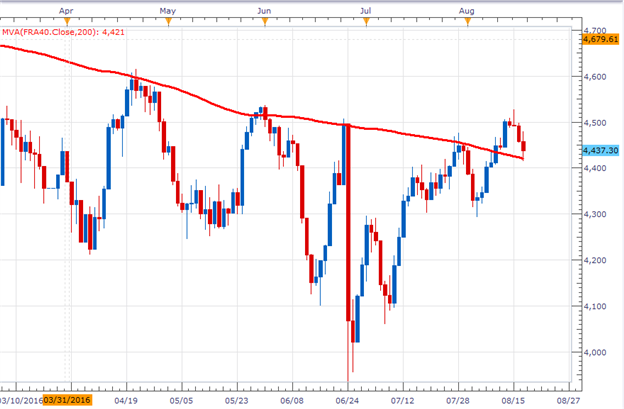
The CAC 40 is set to close lower for the fourth consecutive session, with the Index trading down -0.96%. Of the 40 listed components Legrand has lead the group, advancing +.040%. Technically the index is trading lower, but now finding support at the 200 day SMA (Simple Moving Average). This indicator is displayed in the graph below at a price of 4,421, just above the daily low of 4,414.50. If price remains above this value, it suggests that the CAC 40 may continue to trend higher. However if the index declines here, it suggests that the CAC 40 may be set to resume its broader downtrend.
CAC 40, Daily Chart
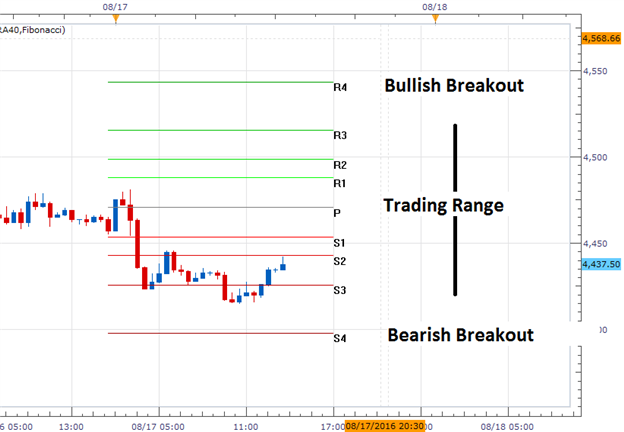
Short term technical levels for the CAC 40 include over the S3 Camarilla pivot, at 4,425.67. Prices are currently testing this value, which is also acting as range support for today’s trading. If prices remain supported here, it opens the CAC 40 to move back towards values of resistance. This includes range resistance at 4,515.67. If prices action closes inside of these values, it may suggest further consolidation for the Index.
Traders looking for a breakout should monitor the S4 pivot at 4,397.86. A move to this value would be significant as it would again place the CAC 40 below its 200 day SMA. Alternatively traders looking for a bullish reversal above 4,543.48. A move above the R4 pivot would signal a significant shift in momentum, and validate longer term support for the Index.
CAC 40, 30 Minute Chart with Pivots
Find out real time sentiment data with the DailyFX’s sentiment page.
To Receive Walkers’ analysis directly via email, please SIGN UP HERE
See Walker’s most recent articles at his Bio Page.
Contact and Follow Walker on Twitter @WEnglandFX.


