


Talking Points
- The CAC 40 Consolidates Ahead of Today’s FOMC Rate Decision
- Daily Channel Resistance is Found Near 4,660
- Sentiment is Negative with SSI reading at -1.28
CAC 40 Daily Chart
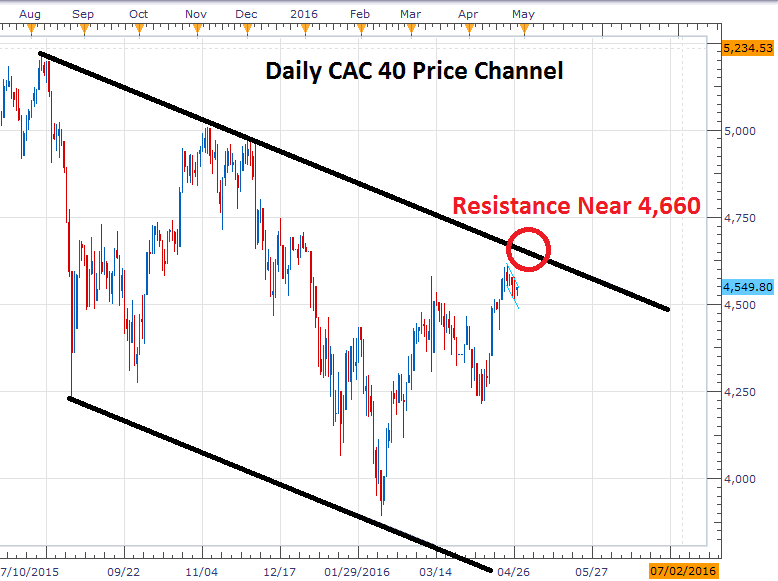
(Created using Marketscope 2.0 Charts)
Find out what is instore for the global equities market. Click HERE for our analysts Free forecast!
The CAC 40 is little changed this morning, trading up .19%, as international markets await todays FOMC rate decision. Expectations are for the FOMC to hold key rates at .50%. Any deviation from this policy could have a systemic effect on markets as central banks are now seen as coordinating their policy decisions. Regardless of the outcome of today’s FOMC event, traders should expect increased volatility from markets around this high importance release.
Technically, the CAC 40 has been trading in a descending price channel going back to the August 2015 high at 5,218. Prices have been retracing slowly back towards channel resistance for the last two months, after putting in a new swing low at 3,890. Now as prices close in on this long-term resistance near4,660, prices are again consolidating.
CAC 40 4Hour Chart

(Created using Marketscope 2.0 Charts)
In the graph below, we can see this consolidating with a short-term price channel developing on the 4Hour chart. If prices breakout above the displayed line of declining resistance, I would then look for prices to challenge the longer term resistance line near 4,660. Alternatively, if prices break lower, it opens prices to retest our previous swing low. In this scenario, traders should first look for prices to challenge the previous swing low at 4,424, followed by a move to a new monthly low beneath 4,211.
Find out the latest positioning totals with DailyFX’s sentiment page
As of this morning SSI (speculative sentiment index) for the CAC 40 (Ticker: FRA40) stands at -1.28 with 56% of positions net short. When taken as a contrarian signal this small negative value has a slight bullish bias. If prices break higher, outside of the depicted price channel, it would be expected to see sentiment figures turn lower. Conversely, if prices channel lower, traders should watch for SSI totals to flip to a positive reading.
To Receive Walkers’ analysis directly via email, please SIGN UP HERE
See Walker’s most recent articles at his Bio Page.
Do you know that the times you trade can be just as important as your trading strategy? Read page 16 of the Traits of Successful Traders Guide to learn about the best times to trade [free registration required].
Contact and Follow Walker on Twitter @WEnglandFX.


