


Talking Points
- The CAC40 continues to decline on geopolitical risk
- Price approaches daily support near 4,420
- Bearish breakouts expose a move to 4,250
CAC40 Daily Chart
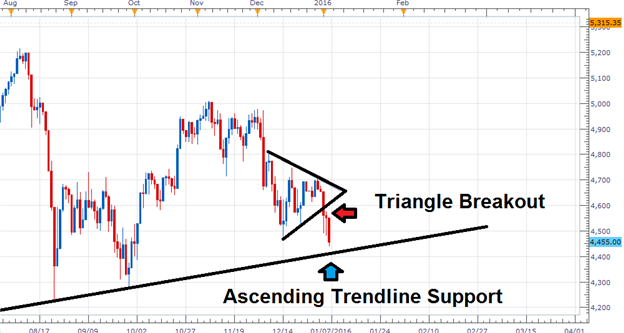
(Created using Marketscope 2.0 Charts)
Losing Money Trading Forex? This Might Be Why.
The CAC40 is trading down 2.3% on the day, amid a broad equities sell off on fresh geopolitical risk aversion. This recent decline has caused price action for the Index to now break below values of support, which includes the December 2015 low at 4,466. A move below this value is also significant because it may also be used to confirm a breakout of the symmetrical triangle depicted above. Using this pricing pattern, bearish traders may look for extensions on the CAC 40 as low as 4,250.
Traders looking for a continued decline should also be aware of long term support, which is found near 4,420. This value is found by creating an ascending trendline, which is formed by connecting a series of lows starting with the October 2014 low at 3,786. If prices break through this line of support, it would signal a significant shift in the current CAC40 trend. Conversely, in the event that prices bounce from support it would suggest that the Index might be headed for a bullish reversal. In this scenario, traders should continue to monitor values of resistance, including the October 2015 high at 5,011, to validate any fresh bullish momentum.
Traders using SSI (Speculative Sentiment Index), to gain a direction bias for the CAC40, should be aware that the index currently sits at +1.5. While this number is not extreme, when taken as a contrarian signal this may suggest future declines for the CAC40. As prices approach support, traders should continue to watch sentiment. A move of SSI over +2 or greater can be used as confirmation of any potential bearish breakouts.
To Receive Walkers’ analysis directly via email, please SIGN UP HERE
See Walker’s most recent articles at his Bio Page.
Do you know the biggest mistake traders make? More importantly, do you know how to overcome the biggest mistake? Read page 8 of the Traits of Successful Traders Guide to find out [free registration required].
Contact and Follow Walker on Twitter @WEnglandFX.
Video Lessons || Free Forex Training
Trading Using Fibonacci (13:08)
Reading the RSI, Relative Strength Index (13:57)


