


EUR/USD, EUR/GBP, EUR/CHF – TALKING POINTS
- EUR/USD made a new low last week, then paused as momentum fades.
- The range has been holding for EUR/GBP as it contemplates a move.
- EUR/CHF punched lower to end last week. Will technicals change the picture?

EUR/USD TECHNICAL ANALYSIS
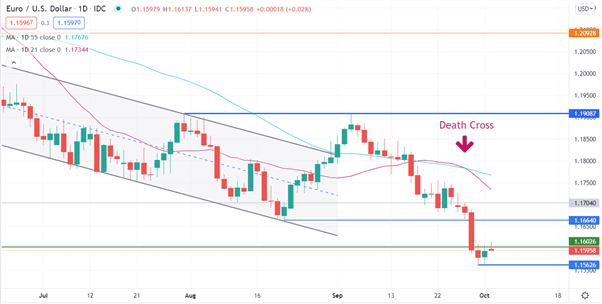
When EUR/USD broke through the upper side of a descending trend channel, it was unable to overcome the previous high of 1.19087. This double top may offer resistance if approached.
EUR/USD has since moved lower and has traded below the previous low of 1.16658. This level is now a pivot point. The low of 1.15625 pierced last year’s November low of 1.16025 but has so far failed to follow through and currently trades near this price.
On the move down, the 21-day simple moving average (SMA) moved below the 55-day SMA to form a Death Cross. The 21-day and the 55-day SMAs now have a negative gradient, combined with the Death Cross, this could indicate bearish momentum.
The 50% Fibonacci retracement of the 2020 low of 1.06359, to the January high of 1.23495, is 1.14927 and this level might provide support if tested.
EUR/GBP TECHNICAL ANALYSIS
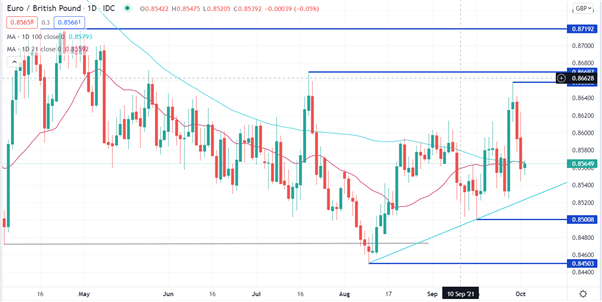
EUR/GBP has been mainly caught in sideways price movement since early this year. The 21-day and 100-day SMAs are tracking on top of each other near the current price, illustrating the stagnate nature of the cross rate. This range pattern might potentially provide opportunities.
If the 21-day SMA breaks away from the 100-day SMA, it could be a directional signal.
The previous lows of 0.85008 and 0.84503 are potential levels of support. On the topside, the previous highs of 0.86583, 0.86697 and 0.87192 may offer resistance.
Trade Smarter - Sign up for the DailyFX Newsletter
Receive timely and compelling market commentary from the DailyFX team
EUR/CHF TECHNICAL ANALYSIS
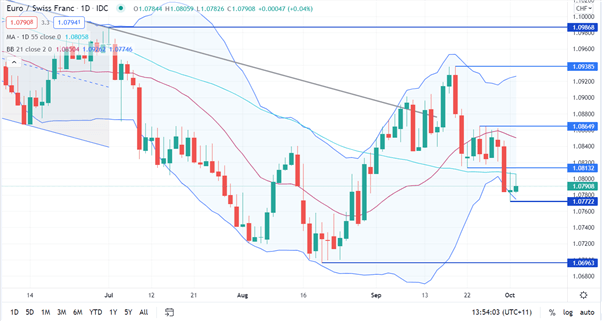
On Thursday last week, EUR/CHF closed outside the lower band of the 21-day SMA based Bollinger Band. On Friday it closed back inside the lower band, which could be bullish.
The price action on Friday also saw a possibly bullish spinning top candlestick formation emerge.
On the topside, levels of possible resistance could be at the 55-day SMA of 1.08058, a pivot point at 1.08132 or the previous highs of 1.08649, 1.09385 and 1.09868. On the downside, potential support may lie at the previous lows of 1.07722 and 1.06963.
--- Written by Daniel McCarthy, Strategist for DailyFX.com
To contact Daniel, use the comments section below or @DanMcCathyFX on Twitter


