


Euro, EUR/USD, Retail Trader Positioning - Technical Forecast
- EUR/USD has been in a near-term uptrend, will this hold?
- Negative RSI divergence does warn that momentum is fading
- Rising Euro long bets from retail traders hint prices may fall

Euro Technical Outlook
The Euro continues to trade in a near-term uptrend against the US Dollar since April. What are some technical obstacles to watch out for that may impede its journey?
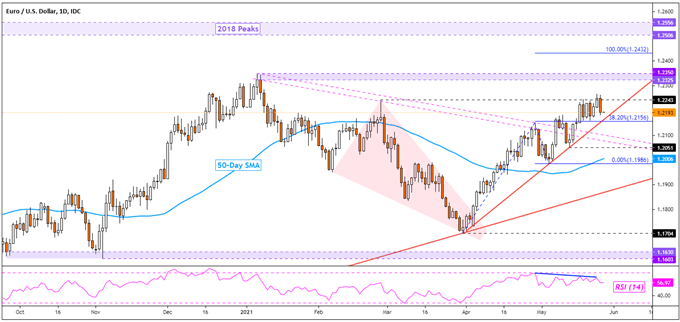
EUR/USD is being guided higher by a rising trendline from the beginning of April. Prices recently rejected the February high at 1.2243, turning lower towards rising support. This also follows the persistent presence of negative RSI divergence. It is a sign of fading upside momentum, which can at times precede a turn lower. Immediate support seems to the 38.2% Fibonacci extension level at 1.2156.
Still, the bias remains tilted to the upside, particularly after the Euro took out falling resistance from the beginning of this year. That placed the focus on the key zone of resistance between 1.2325 and 1.2350 on the daily chart below. Taking this area out may open the door to revisiting peaks from 2018. Otherwise, a drop under near-term rising support may open the door to testing the 50-day Simple Moving Average.
EUR/USD Daily Chart
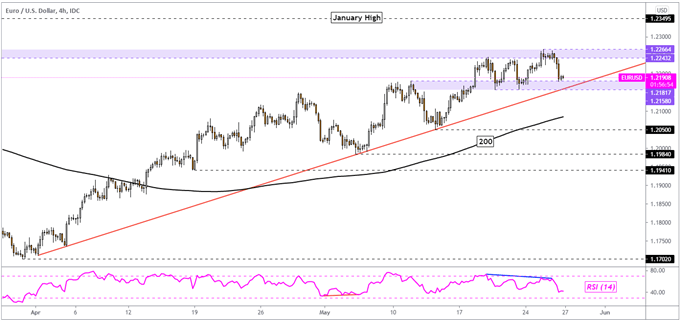
Zooming in on the 4-hour chart also reveals negative RSI divergence. A closer look at the February high rejection reveals a zone of resistance between 1.2243 and 1.2266. Immediately below appears to be the 1.2158 – 1.2181 inflection zone. This area is also where the rising trendline from April comes into play. A breakout under this area may open the door to testing the 200-period SMA. The latter could at that point reinstate the focus to the upside.

EUR/USD 4-Hour Chart
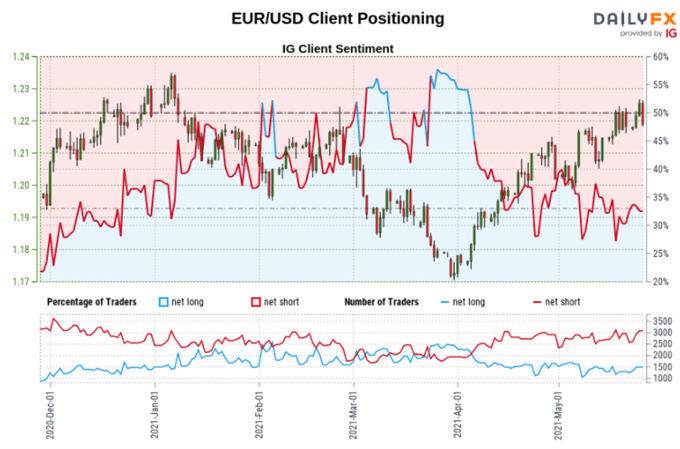
The IGCS gauge shows that about 36% of retail traders are net-long EUR/USD. Upside exposure has increased by 6.61% and 26.31% over a daily and weekly basis respectively. The fact that the majority of traders are net-short hints that prices may continue rising. But, recent changes in sentiment warn that the Euro may turn lower despite the fact traders remain net-short.
Euro Retail Trader Positioning
--- Written by Daniel Dubrovsky, Strategist for DailyFX.com
To contact Daniel, use the comments section below or @ddubrovskyFX on Twitter


