


Euro, EUR/USD, EUR/JPY, IGCS – Talking Points:
- The Euro looks poised to extend its recent gains against its major counterparts in the weeks ahead.
- EUR/USD eyeing a test of key range resistance.
- EUR/JPY pressuring downtrend extending from the 2008 highs.

The Euro has rebounded robustly against its major counterparts in the month of April. This period of strength looks set to endure in the coming weeks, as bullish long-term technical setups point to further upside for the trading bloc’s currency. Here are the key levels to watch for EUR/USD and EUR/JPY rates.
EUR/USD Weekly Chart – Keying in on Range Resistance
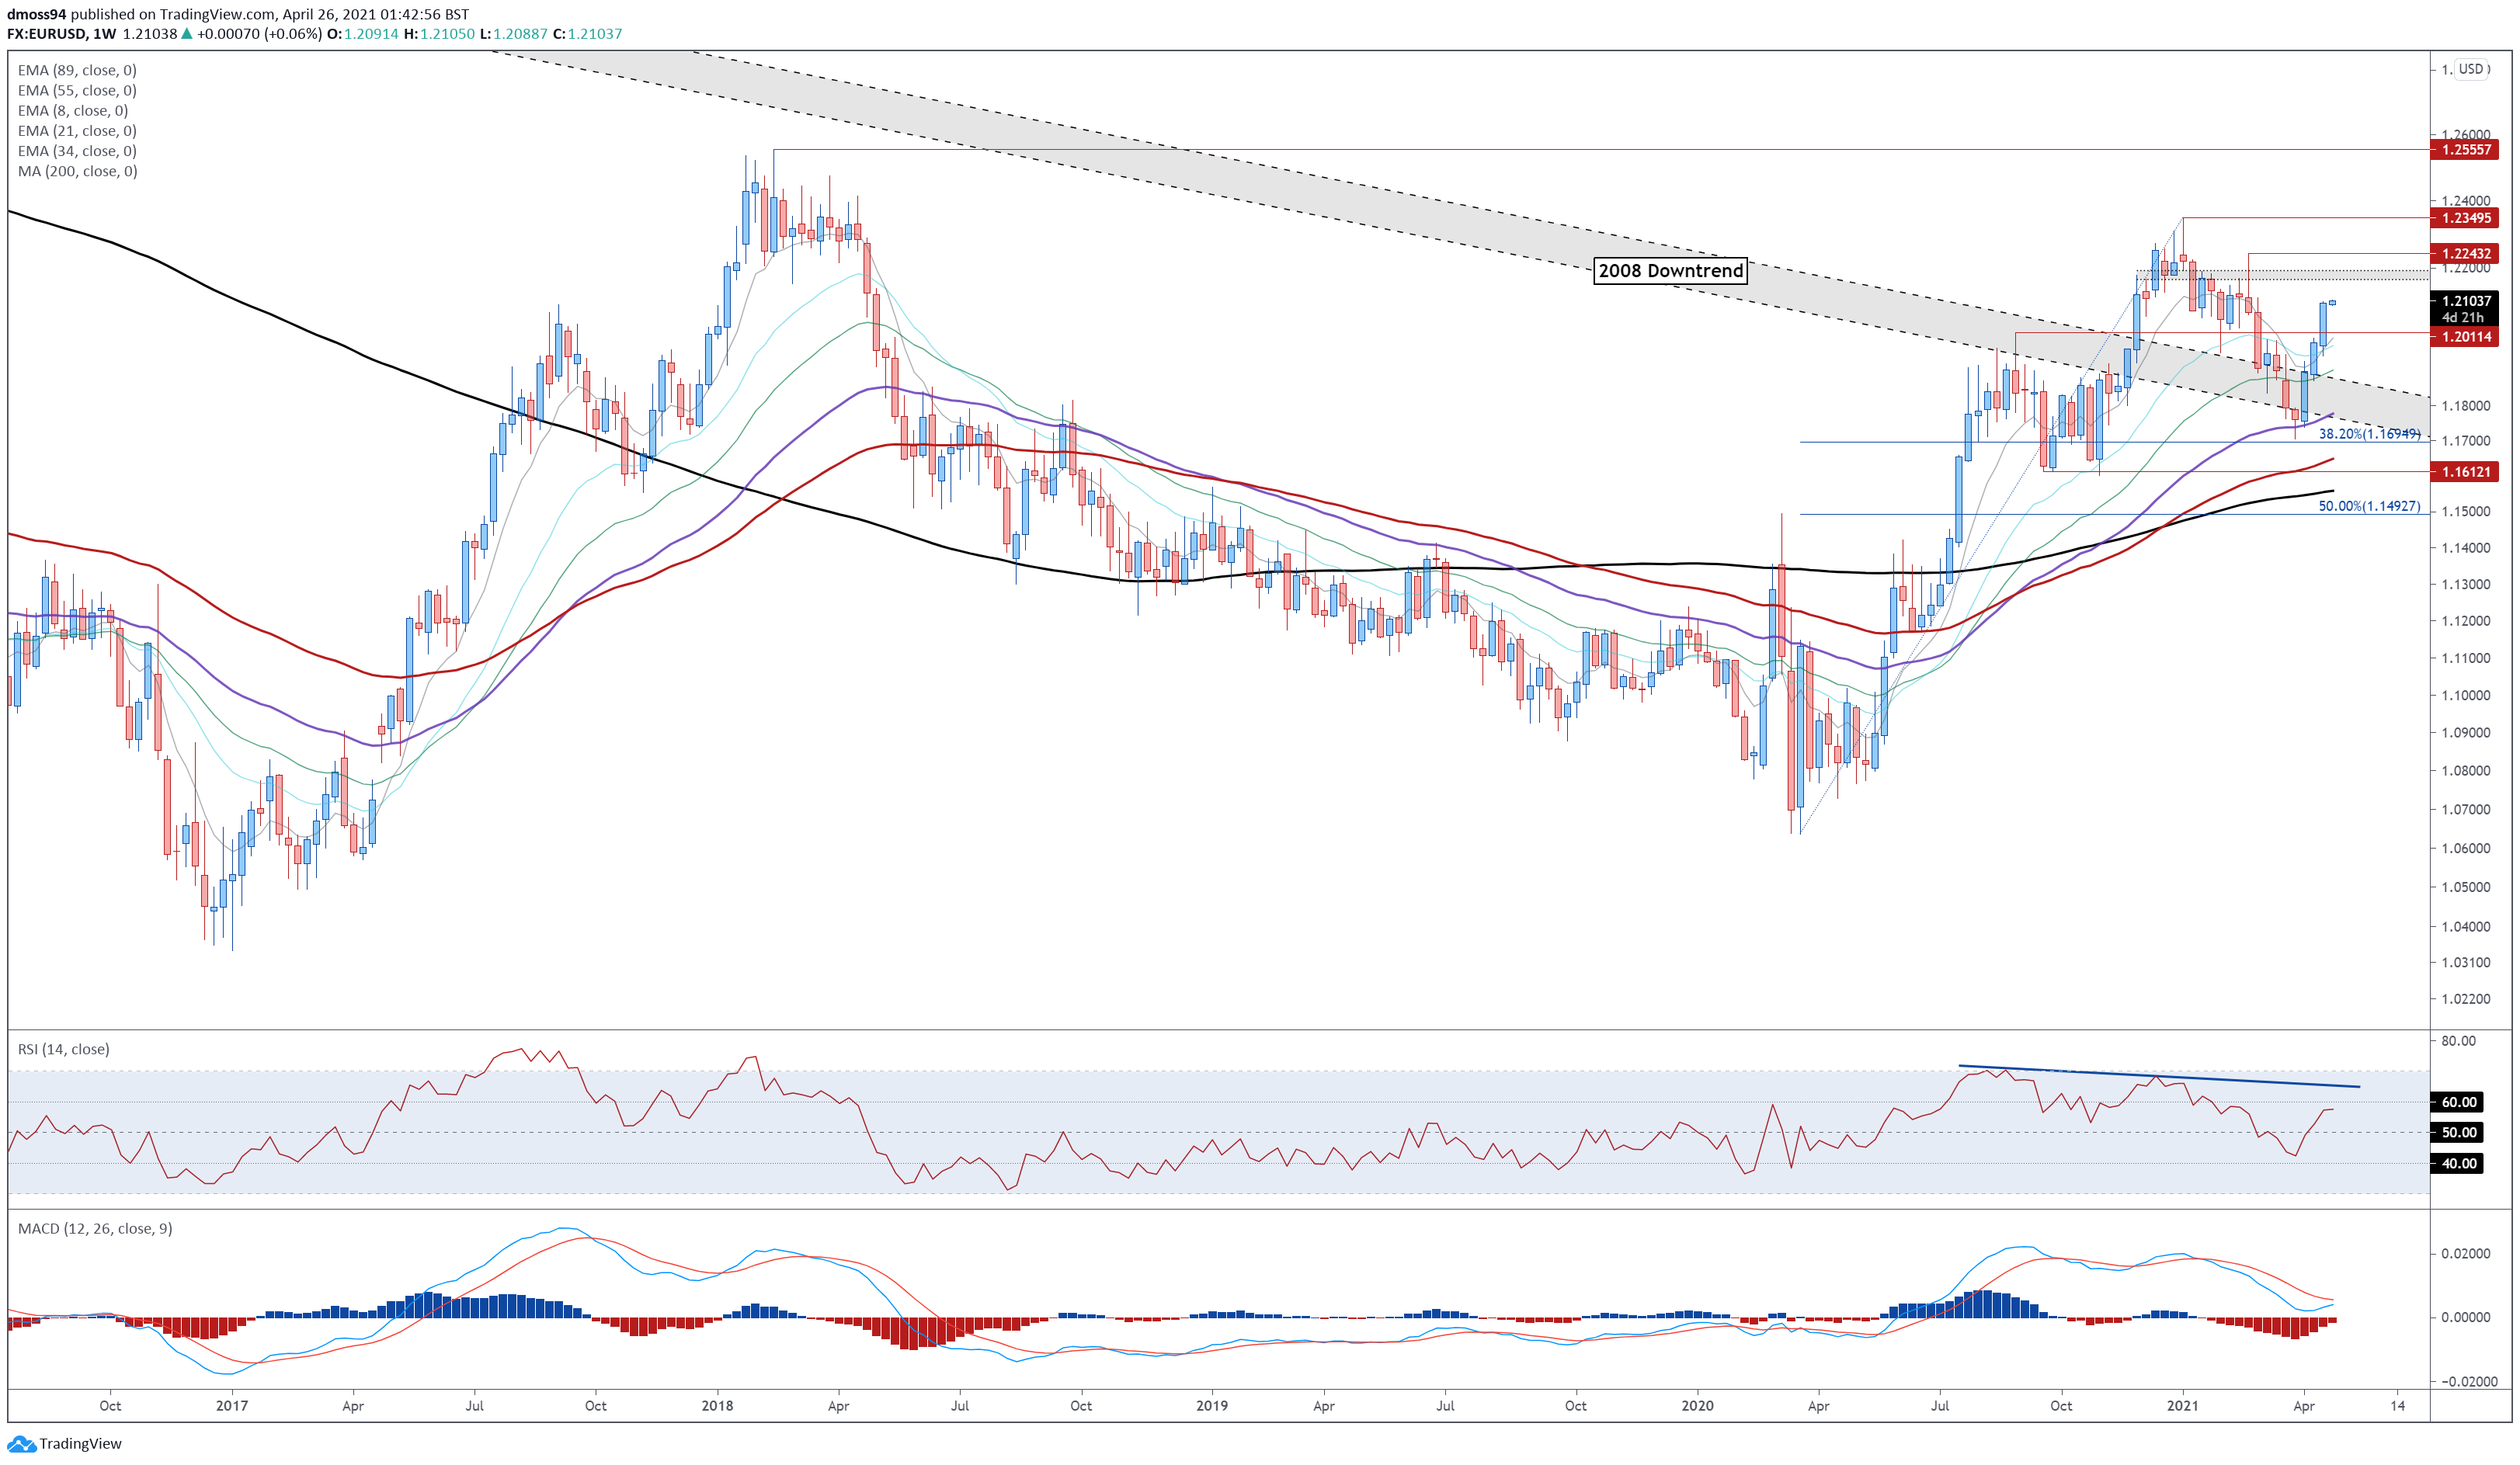
Chart prepared by Daniel Moss, created with Tradingview
The EUR/USD exchange rate has surged higher in April, after toppling back to challenge the 55-EMA (1.1777) for the first time since May 2020.
Further gains appear in the offing, as the RSI and MACD track firmly above their respective neutral midpoints, and price remains constructively positioned above psychological support at 1.2000.
The exchange rate looks set to probe the resistance range at 1.2270 – 1.2290 in the weeks ahead, with a convincing break above that bringing the yearly high (1.2349) into the crosshairs.
However, if range resistance remains intact, a pullback to former resistance-turned-support at the August 2020 high (1.2011) could precede the next move higher.
EUR/USD Daily Chart – Falling Wedge Hints at Further Gains

Chart prepared by Daniel Moss, created with Tradingview
Zooming into the daily chart bolsters the bullish outlook depicted on the weekly timeframe, as prices validate the break of a bullish Falling Wedge pattern and accelerate back above all six moving averages.
Indeed, with the MACD climbing to its highest levels since January, and the RSI eyeing a push into overbought territory, the path of least resistance seems skewed to the upside.
Holding constructively above 1.2080 opens the door for the exchange rate to probe psychological resistance at 1.2200. Hurdling that carves a path to challenge the yearly high (1.2349).
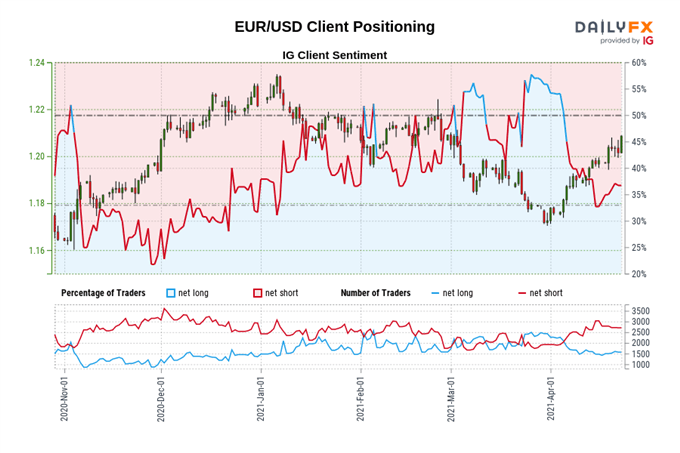
The IG Client Sentiment Report shows 31.57% of traders are net-long with the ratio of traders short to long at 2.17 to 1. The number of traders net-long is 14.64% lower than yesterday and 11.94% lower from last week, while the number of traders net-short is 10.94% higher than yesterday and 4.79% higher from last week.
We typically take a contrarian view to crowd sentiment, and the fact traders are net-short suggests EUR/USD prices may continue to rise.
Traders are further net-short than yesterday and last week, and the combination of current sentiment and recent changes gives us a stronger EUR/USD-bullish contrarian trading bias.
EUR/JPY Weekly Chart – 2008 Downtrend Under Pressure

Chart prepared by Daniel Moss, created with Tradingview
EUR/JPY rates also look set to climb higher in the coming weeks, as prices challenge the downtrend extending from the 2008 highs.
A potential bullish Golden Cross moving average formation, in combination with both the MACD and RSI hovering at multi-year highs, could intensify buying pressure in the near term.
A weekly close above 131.00 probably signals the resumption of the primary uptrend and clears a path for the exchange rate to test the April 2018 high (133.49).
However, if 131.00 holds firm, prices could fall back towards the 8-EMA (129.92).
EUR/JPY Daily Chart – Bullish MA Stacking to Encourage Buyers

Chart prepared by Daniel Moss, created with Tradingview
The daily timeframe also hints at further upside for EUR/JPY, as prices hold above psychological support at 130.00 and all six moving averages.
A daily close above 130.67 is needed to validate bullish potential and clear a path for the exchange rate to climb to challenge the 61.8% Fibonacci (131.74).
That being said, if resistance successfully neutralizes buying pressure, a short-term pullback to confluent support at the monthly low (129.59) and uptrend extending from the May 2020 lows seems relatively likely.
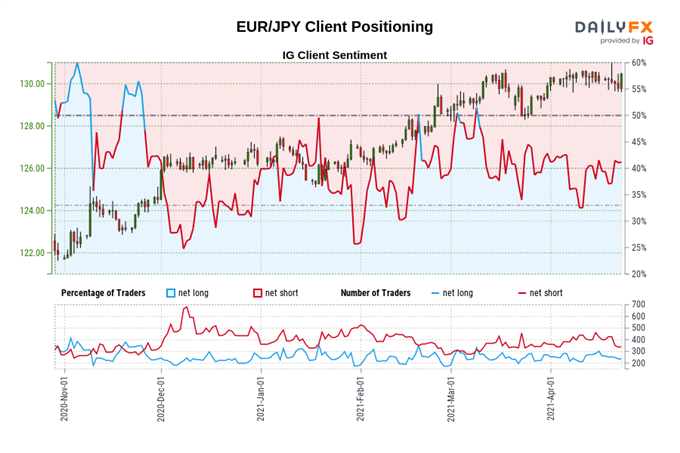
The IG Client Sentiment Report shows 36.30% of traders are net-long with the ratio of traders short to long at 1.75 to 1. The number of traders net-long is 8.20% lower than yesterday and 15.79% lower from last week, while the number of traders net-short is 13.91% higher than yesterday and 4.15% lower from last week.
We typically take a contrarian view to crowd sentiment, and the fact traders are net-short suggests EUR/JPY prices may continue to rise.
Traders are further net-short than yesterday and last week, and the combination of current sentiment and recent changes gives us a stronger EUR/JPY-bullish contrarian trading bias.
-- Written by Daniel Moss, Analyst for DailyFX
Follow me on Twitter @DanielGMoss


