


Euro, EUR/USD – Talking Points
- Euro has been cautiously appreciating vs major peers
- EUR/USD recent gains stall at 2018 falling trend line
- Is this the turning point for the most-liquid FX pair?
Euro Technical Analysis
Against a basket of its major counterparts, the Euro has been making cautious upside progress since early May. On the chart below is my majors-based Euro index, which averages the single currency against USD, JPY, GBP and AUD. Guiding EUR higher could be a potential rising trend line from the middle of February. A third test of the support line may confirm it.

Moreover, key support sits immediately below between 1.5043 – 1.5099. Here more buyers could enter the market and cap downside progress following the emergence of negative RSI divergence. The latter shows fading upside momentum which can at times precede a turn lower. Taking out 1.5344 could open the door for the Euro to prolong its recent advance against its major peers.
Majors-Based Euro Index – Daily Chart

*Majors-Based EUR Index Averages Euro Versus USD, JPY, GBP and AUD
EUR/USD Technical Outlook
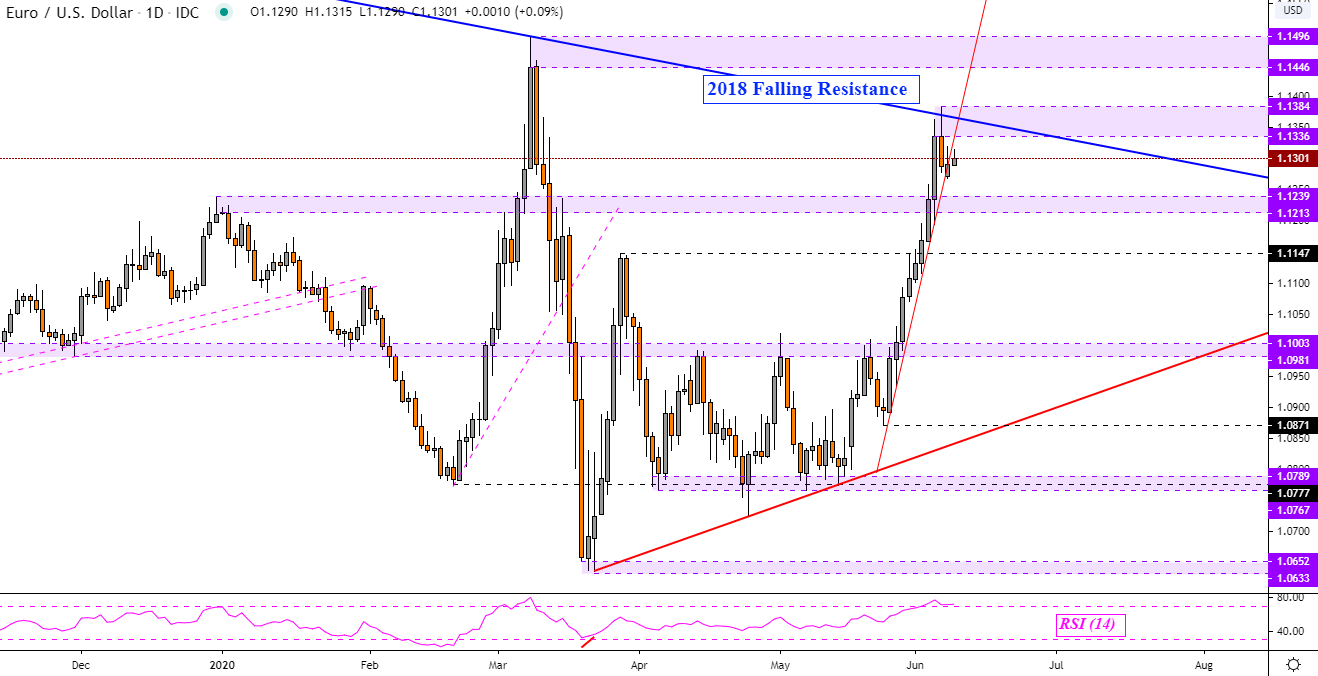
This is as EUR/USD just rejected a test of falling resistance from 2018 on the daily chart below. This left behand a range of resistance between 1.1384 – 1.1336. The trend line and the latter barrier are what stand in-between where prices are and March peaks (1.1446 – 1.1496). EUR/USD is also appearing to stall as rising support from late May is at risk to being broken.
If the latter falls apart, that could send the pair towards the 1.1213 – 1.1239 inflection point. Should the Euro descend through the latter, that may catalyze a deeper selloff that could lead to a reversal of the aggressive gains since last month. That may then open the door to testing 1.1147 followed by the 1.0981 – 1.1003 inflection area on the way towards 1.0871.
| Change in | Longs | Shorts | OI |
| Daily | 1% | 4% | 2% |
| Weekly | 28% | -5% | 16% |
EUR/USD - Daily Chart
--- Written by Daniel Dubrovsky, Currency Analyst for DailyFX.com
To contact Daniel, use the comments section below or @ddubrovskyFX on Twitter


