


EUR/USD TECHNICAL ANALYSIS: BEARISH
- Euro attempting to break 2-month range top near 1.10 figure
- RSI divergence on near-term charts warns momentum fading
- Trader sentiment studies warning of bearish positioning shift
The Euro is back to testing now-familiar range resistance in the 1.0992-1.1009 area, a barrier capping upside progress since early April. Securing a breakout on a daily closing basis seems to initially open the door for a test of the March 27 swing high at 1.1147.
Alternatively, a reversal that brings EUR/USD below range midline support is at 1.0891 puts the formation’s floor in the 1.0768-78 zone into focus. Breaking below that would double as a breach of rising trendline support, a move that may mark longer-term down trend resumption. The March low at 1.0636 follows.
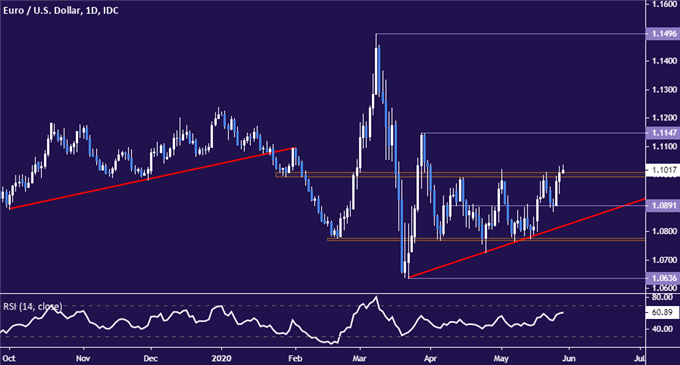
EUR/USD daily chart created with TradingView
Zooming in to the four-hour chart suggests EUR/USD may be on course to break higher already. Seen through this lens, prices have already managed to close above the range top. More tellingly still, the underside of this barrier held up on retest as support, implying that a base for a push upward may be forming.
Still, price action is often choppier on lower time frames, making would-be breakouts appear more frequent but implying less about their scope for follow-through. Furthermore, negative RSI divergence warns that momentum may be ebbing, which might be laying the groundwork for a pullback.
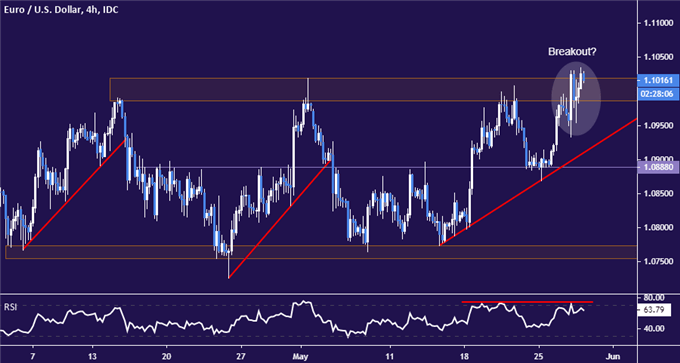
EUR/USD 4-hour chart created with TradingView

EUR/USD TRADER SENTIMENT
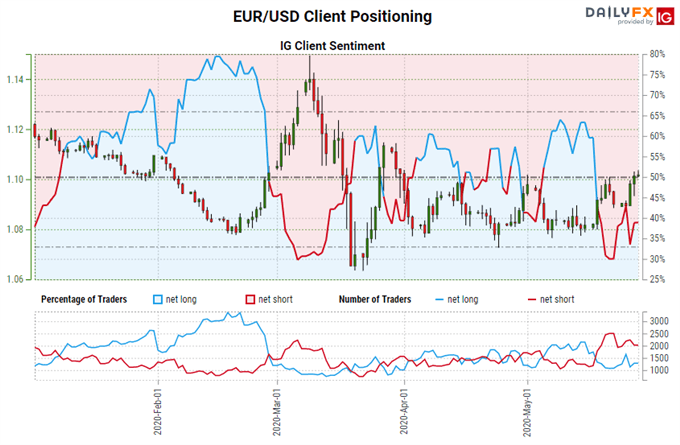
Retail trader positioning data suggests that 61.74% of market participants are net-short EUR/USD, with the short-to-long ratio at 1.61 to 1. IG Client Sentiment (IGCS) is typically used as a contrarian indicator, so the tilt in traders’exposure suggests the trend is biased upward.
However, the skew in exposure has narrowed recently. The number of traders net-short is 11.71% lower than yesterday and 18.14% lower from last week. This warns that a positioning flip in favor of the downside may be brewing on the horizon.
See the full IGCS sentiment report here.

EUR/USD TRADING RESOURCES
- Just getting started? See our beginners’ guide for traders
- What is your trading personality? Take our quiz to find out
- Join a free webinar and have your trading questions answered
--- Written by Ilya Spivak, Head APAC Strategist for DailyFX
To contact Ilya, use the comments section below or @IlyaSpivak on Twitter


