


EUR/USD Technical Forecast
See Our latest trading guides for free and discover what is likely to move the markets through Q4 of this year.
EUR/USD – Hesitant Sellers
Last week, bearish momentum led EUR/USD to its lowest level in five weeks at 1.0989. However, downtrend move paused reflecting seller’s reluctance to press the price further at this stage. This opened the door at the start of this week for buyers to take the initiative and rally the price.
On Friday, the Relative Strength Index (RSI) crossed above 50 however, the oscillator remained flat, highlighting weak buyers and weaker sellers.
Having trouble with your trading strategy? Need a hand? Here’s the #1 Mistake That Traders Make
EUR/USD Daily PRice CHART (Mar 31, 2017 – Nov 21, 2019) Zoomed Out

EUR/USD Daily Price CHART (May 22 – Nov 21, 2019) Zoomed in
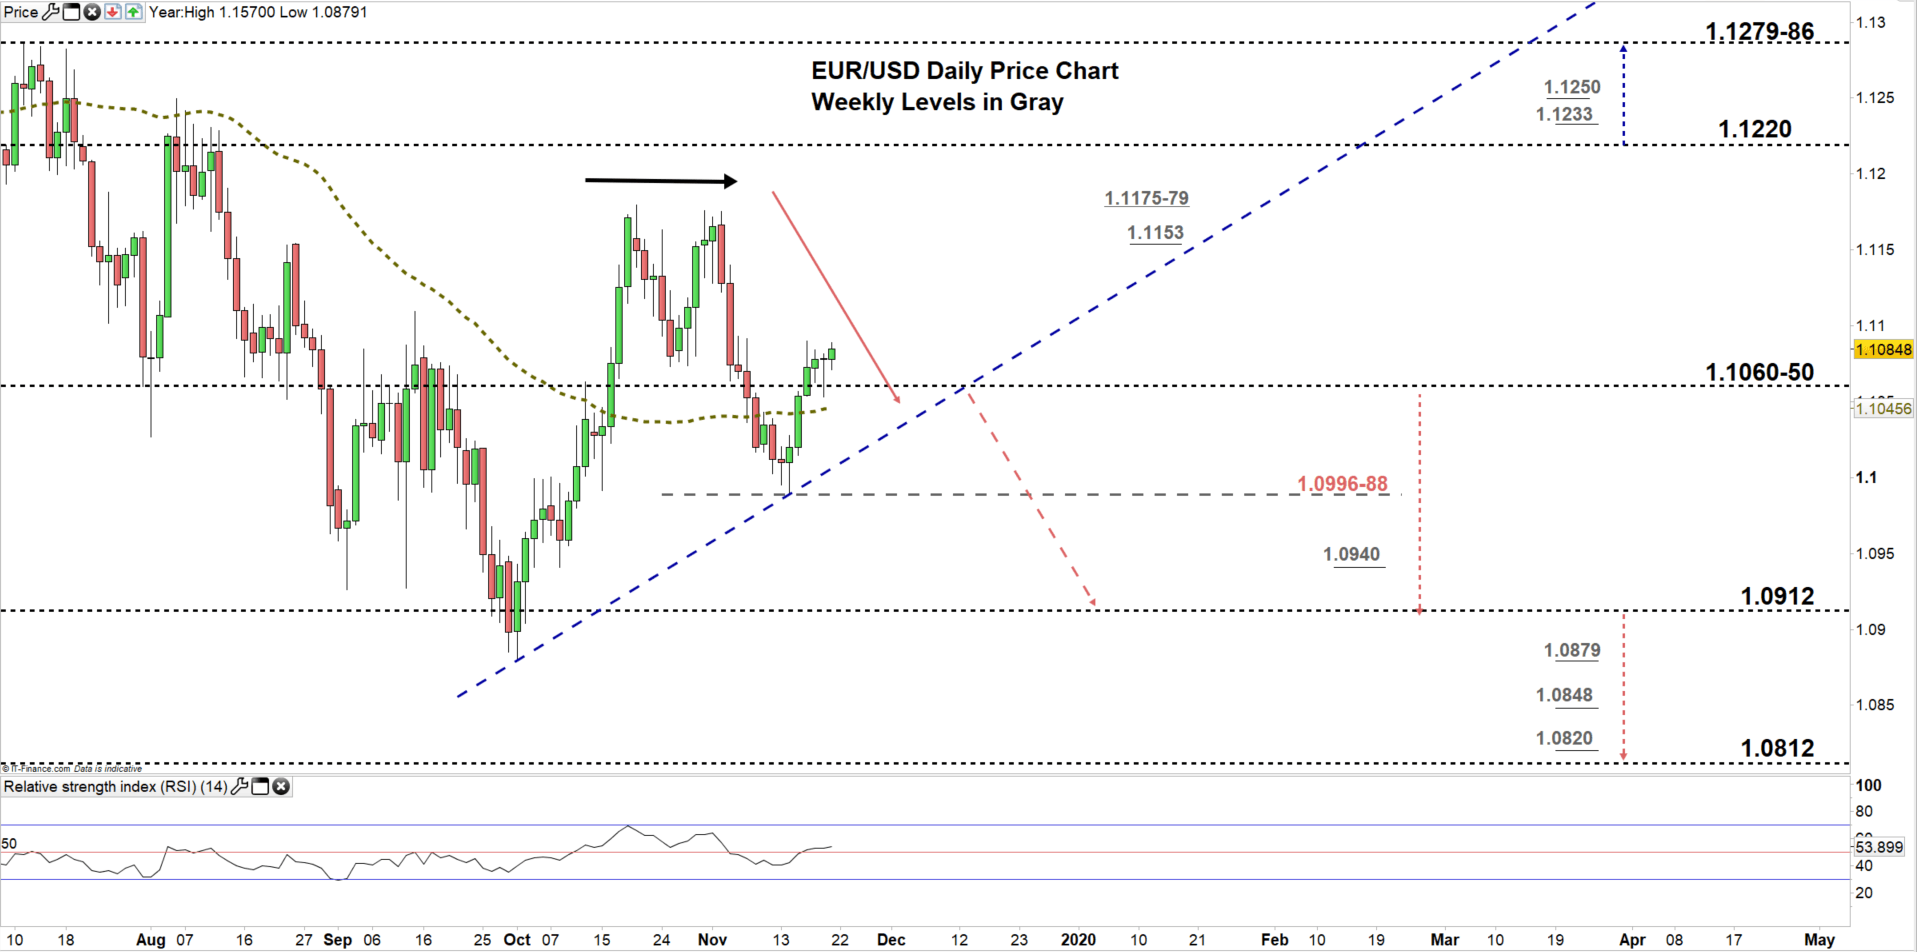
Looking at the daily chart, we notice on Monday EUR/USD rallied to a higher trading zone 1.1050 -1.1220. Yesterday, the pair tested trading below this zone however, the price reverted back then closed above the low end, highlining buyers have not exited the market yet. Therefore, buyers may peruse pushing the price towards the high end of the zone.
That said, any close below the low end of the zone could convince sellers to press EURUSD towards 1.0912. Further close below this level may mean more bearishness towards 1.0812. In that scenario, the daily area with the weekly levels marked on the chart should be considered.
Just getting started? See our Beginners’ Guide for FX traders
EUR/USD four Hour Price CHART (SEp 26 – Nov 21, 2019)

From the four-hour chart, we notice at the start of this week EUR/USD rallied to 1.1090 then traded lower as buyers took profit. Today, the pair has rallied back then stopped nearby this level. Thus, any reversal at this stage would lead to a possible double top pattern.
This suggests if EURUSD breaks and remains below the neckline located at 1.1050, sellers could send the price towards 1.1027. On the flip side, a break above 1.1130 could persuade buyers to rally the price towards 1.1175. Nevertheless, the weekly resistance levels underlined on the chart should be watched closely.
See the chart to know more about key levels the price would encounter in a further bullish/ bearish move.
Written By: Mahmoud Alkudsi
Please feel free to contact me on Twitter: @Malkudsi


