


EUR/USD and EUR/JPY Technical Outlook
- Euro and Japanese Yen price action against US Dollar
- USD/JPY, EUR/USD price action
See Our latest trading guides for free and discover what is likely to move the markets through Q4 of this year.
USD/JPY, EUR/USD – Paused Downtrend move
On Oct 1, EUR/USD printed 1.0879- its lowest level in nearly 30 months. However, the price rebounded and settled this week above 1.0900 handle. Similarly, USD/JPY rallied from its three weeks low and currently trading above 107.00.
The Relative Strength Index (RS) rose on both pairs, nearly testing 50 level on both pairs indicating to a stalled downtrend momentum, and to the buyer’s lack of impulse to start uptrend move.
Having trouble with your trading strategy? Need a hand? Here’s the #1 Mistake That Traders Make
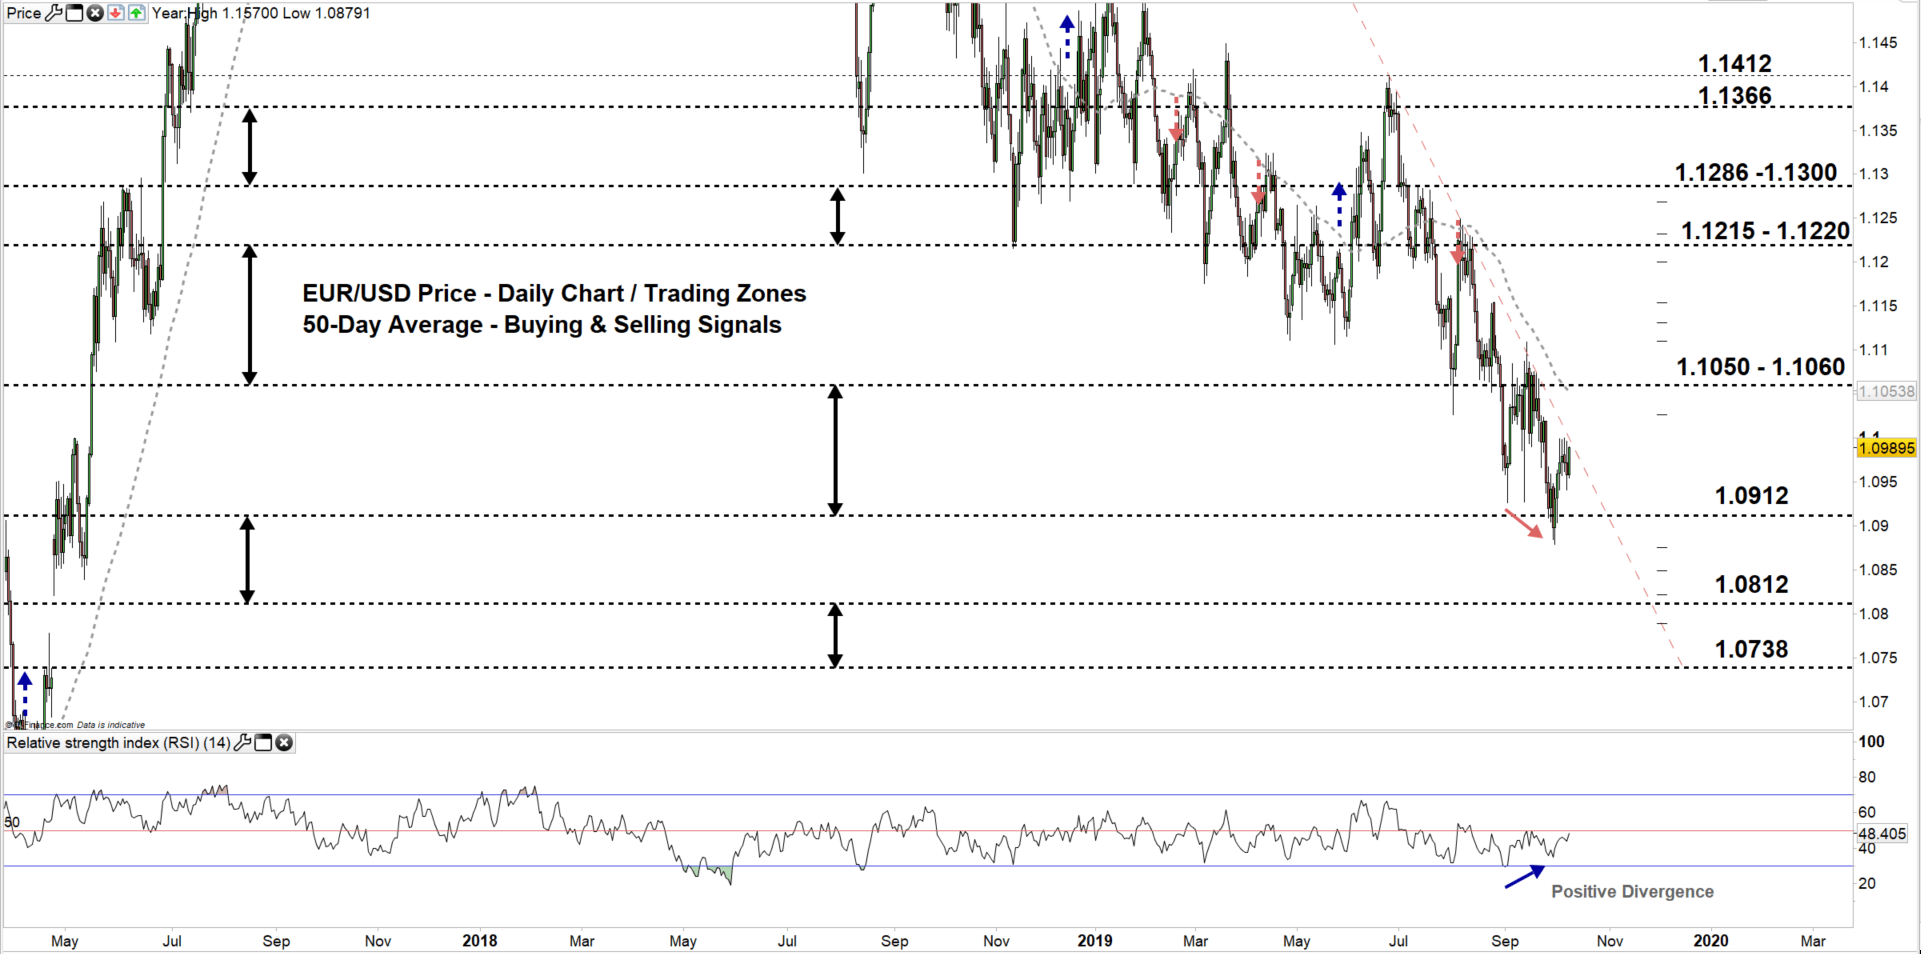
EUR/USD Daily PRice CHART (March 28, 2017 – OCt 9, 2019) Zoomed Out
EUR/USD Daily Price CHART (June16 – Oct 9, 2019) Zoomed in
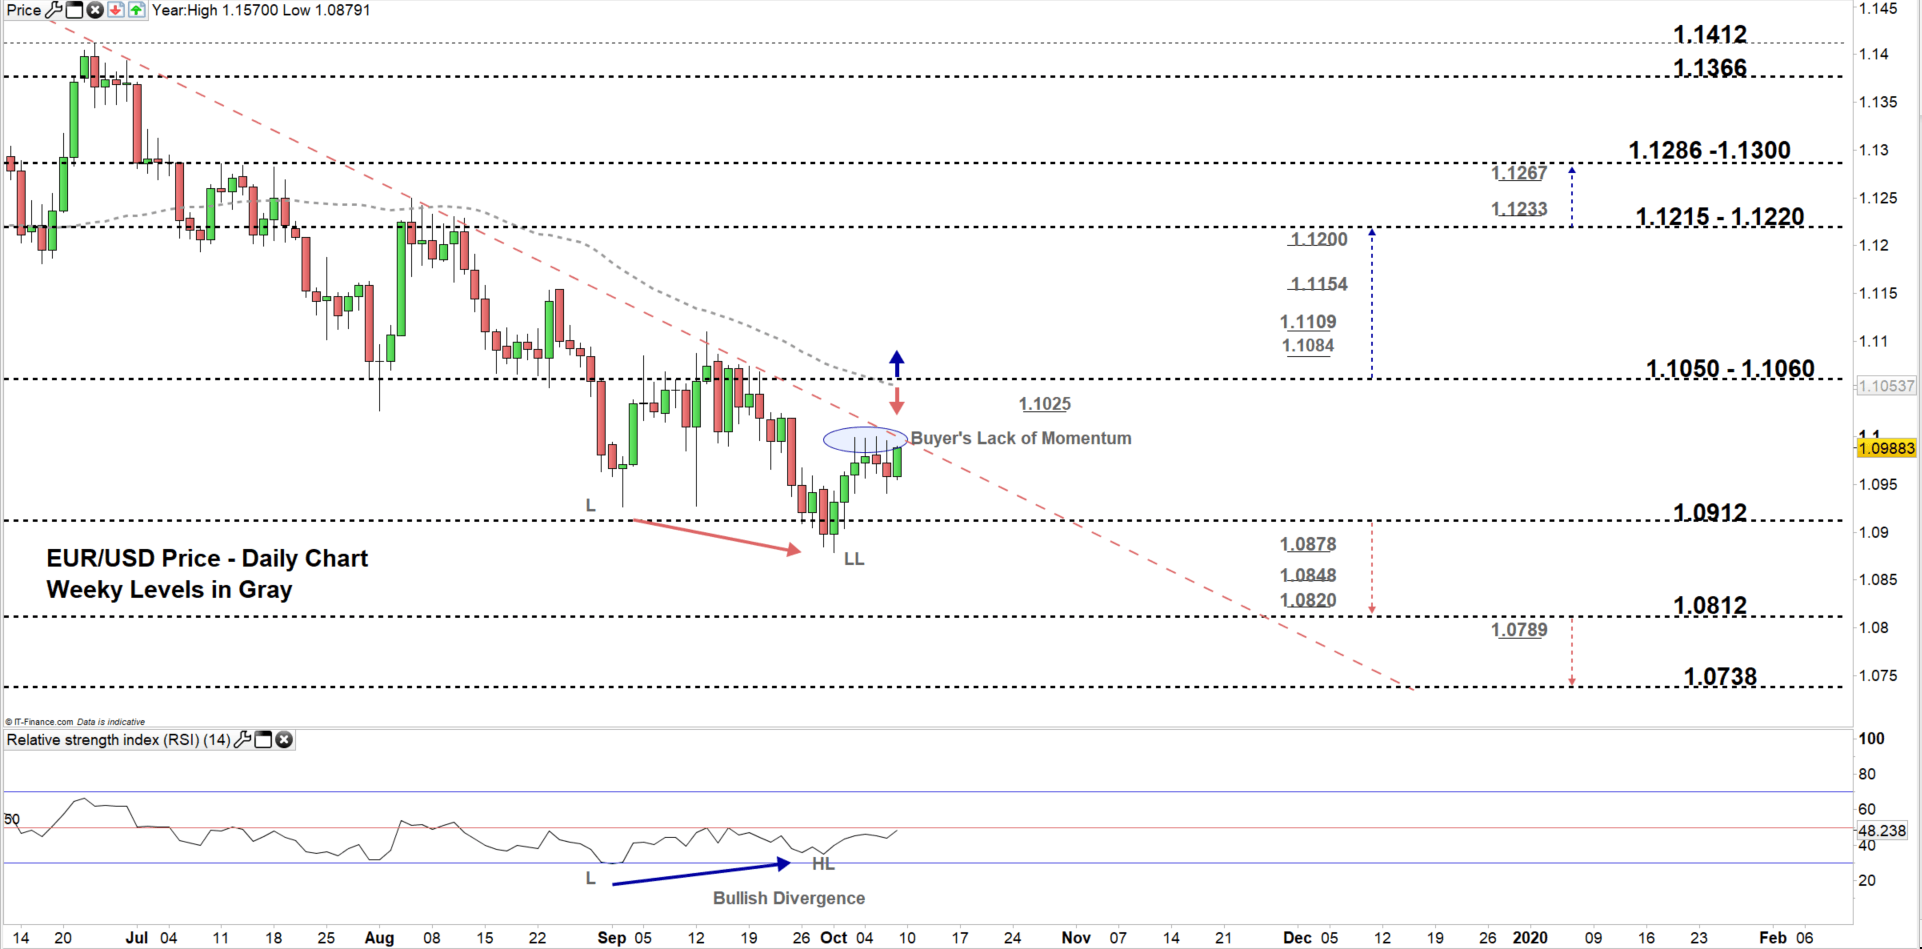
Looking at the daily chart we notice, EUR/USD still trading in a bearish move below the downtrend line originated from the June 25 high at 1.1412. On Oct 1, the pair returned to the old trading zone 1.0912 – 1.1050 eyeing a test of the high end of it, however, buyers have been showing weakness as failed four times in a row to clear 1.1000 Handle.
Its worth noting that, a close above 1.1060 could open the door for EURUSD to correct higher and may embolden buyers to push towards the vicinity of 1.1215-20. Although, the weekly resistance levels underscored on the chart should be considered.
Having said that, a close below the low end of the low end of the zone could resume bearish price action sending EURUSD towards 1.0812. Although, the weekly support levels marked on the chart should be kept in focus. See the chart to know more about the key levels the pair would encounter in a further bearish move.
Just getting started? See our Beginners’ Guide for FX traders
USD/JPY Daily PRice CHART (April 11, 2017– Oct 9, 2019) Zoomed Out

USD/JPY Daily PRice CHART (June 10 – OCt 9, 2019) Zoomed In
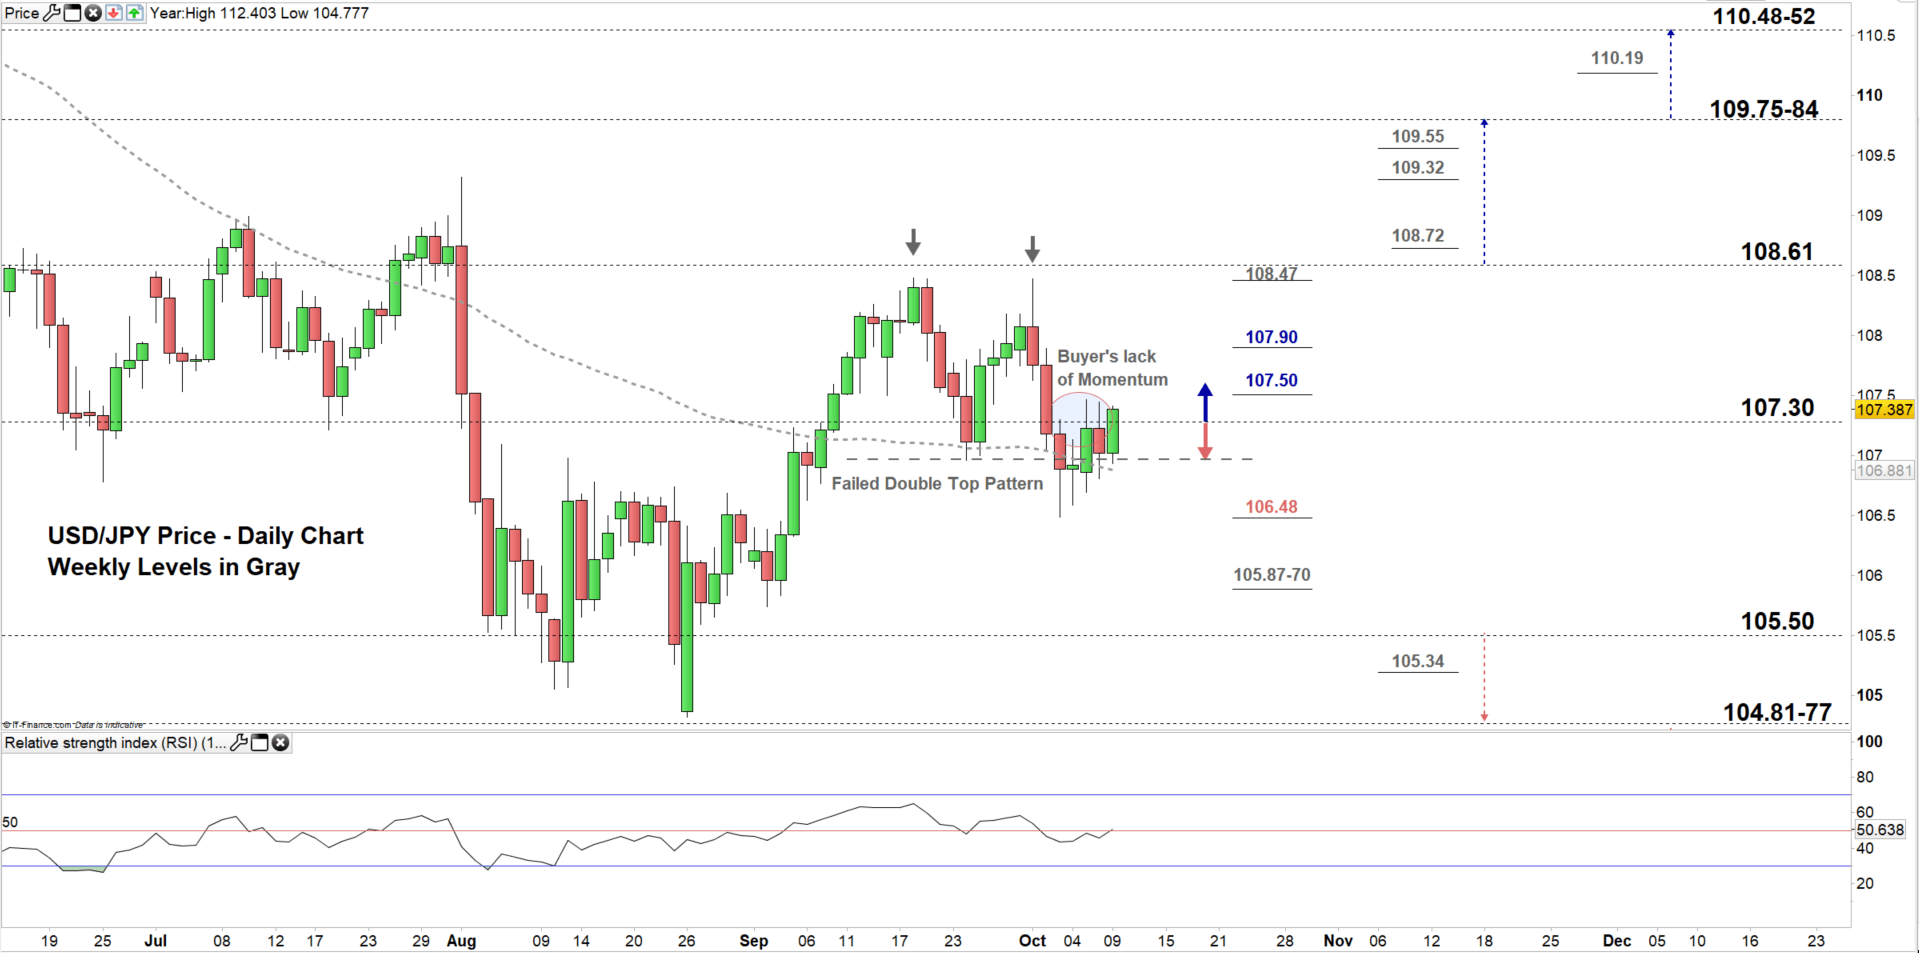
From the daily chart, we notice on Oct 3 USD/JPY broke below the neckline of double top pattern residing at 106.96. However, at the start of the week the price rebounded and closed above the neckline negating this technical formation. Although, it's also clear buyer’s lack of momentum as they failed twice this week to force a close above the high end of the zone.
Therefore, more failure in closing above the high end of current trading zone 105.50 – 107.30 could reverse the price’s direction sending it towards the low end of the zone. Although, the daily and weekly support level and area marked on the chart (zoomed in) should be watched closely.
On the other hand, a successful close above the high end could a rally towards 108.61. In that scenario, the daily and weekly resistance levels underlined on the chart would be worth monitoring.
Written By: Mahmoud Alkudsi
Please feel free to contact me on Twitter: @Malkudsi


