


EURUSD Technical Strategy: BEARISH
- Euro struggling to extend down move below 1.11 mark vs US Dollar
- Rising wedge pattern, RSI divergence hint a bottom may be forming
- Daily close above 1.13 needed to neutralize near-term bearish bias
See our free trading guide to help build confidence in your EURUSD trading strategy !
The Euro was unable to find lasting downside momentum on a break of counter-trend line support set from late April lows. Prices spiked lower to test support just above the 1.11 figure against the US Dollar but fell short of securing a breakout, bouncing to retest the 1.1175-86 chart inflection region instead.
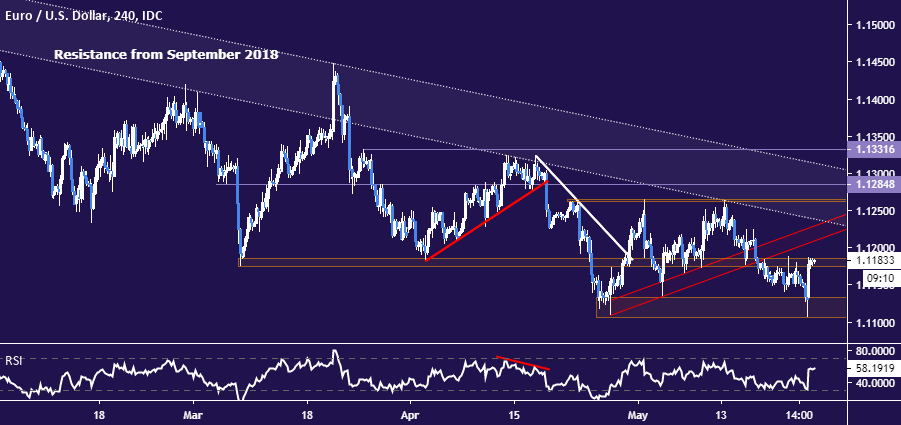
The bounce still looks broadly corrective and, in any case, the bounds of the dominant near-term downtrend set from September 2018 remain firmly intact. Invalidating that would now require a rally back above the 1.13 figure. Still, sellers’ inability to follow through is noteworthy as broader positioning seems conflicted.
Turning to the daily chart, the outlines of a bullish Falling Wedge formation coupled with positive RSI divergence warn that a rebound may be in the cards. As much is unconfirmed for now and the setup may yet unravel in the bears’ favor. Ongoing EU Parliament elections may be a catalyst one way or the other.
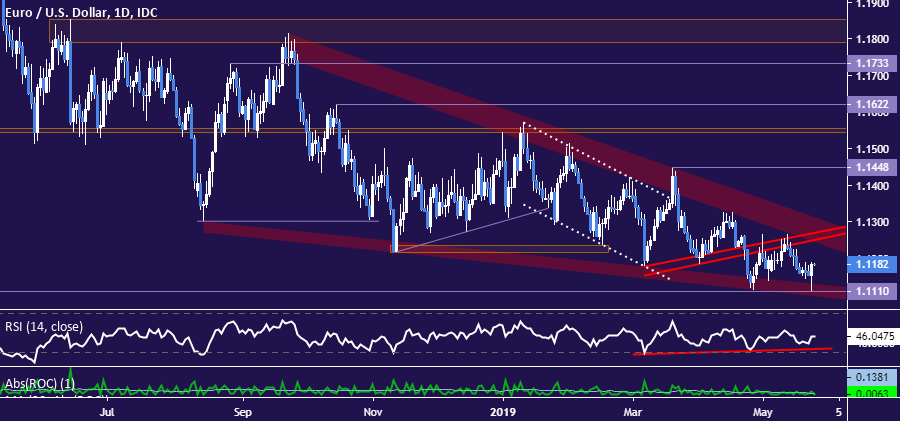
A daily close above the wedge top – now at 1.1311 – sets the stage for a test above the 1.14 handle. Immediate support is at 1.1097, marked by a chart inflection point dating back to May 2017 and the wedge bottom. Pushing below that is likely to see the next downside hurdle at 1.1024, another former sticking point.
EURUSD TRADING RESOURCES
- Just getting started? See our beginners’ guide for FX traders
- Having trouble with your strategy? Here’s the #1 mistake that traders make
- Join a free webinar and have your questions answered
--- Written by Ilya Spivak, Currency Strategist for DailyFX.com
To contact Ilya, use the comments section below or @IlyaSpivak on Twitter


