To receive Ilya's analysis directly via email, please SIGN UP HERE
Talking Points:
- EUR/USD Technical Strategy: Short at 1.0684
- Euro cautiously edging toward 1.06 figure against the US Dollar
- Slow progress puts volatility at the lowest level in over 5 months
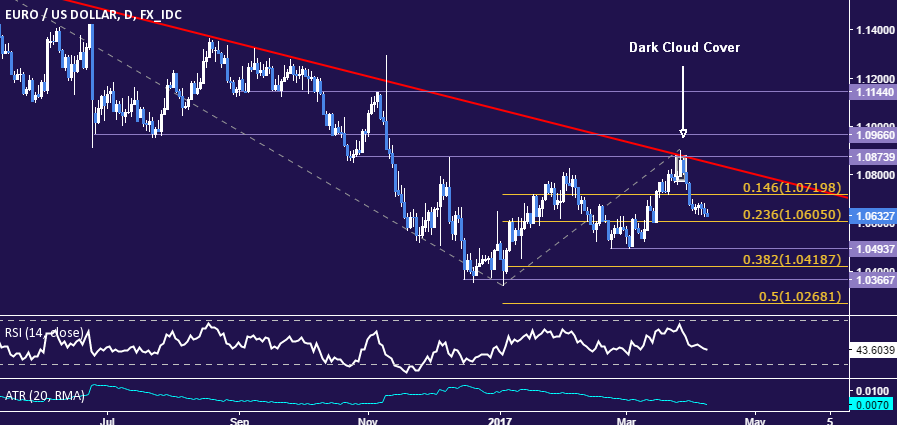
The Euro continues to edge lower against the US Dollar having established a top with the formation of a bearish Dark Cloud Cover candlestick pattern, as expected. Momentum has been painfully slow however, with ATR-measured volatility down the lowest level in over five months.
From here, a daily close below the 23.6% Fibonacci expansionat 1.0605 paves the way for a test of the February 22 low at 1.0494. Alternatively, a turn back above support-turned-resistance marked by the 14.6% Fibat 1.0720 exposes trend-defining resistance at 1.0874 (former support, trend line).
The short EUR/USD position activated at 1.0684 is making slow progress toward its initial target at 1.0605. Half of the trade will be closed upon hitting this level. The stop-loss remains set to trigger on a daily close above 1.0720 but will be moved to breakeven once the first object is met.
What do retail traders’ buy/sell decisions hint about the Euro trend? Find out here !