


Talking Points
-EUR/USD carves its tightest 20 day trading range since August 2014
-FOMC meeting on Wednesday is likely to keep volumes and price action muted
-Favor a range bound strategy until this trading range breaks
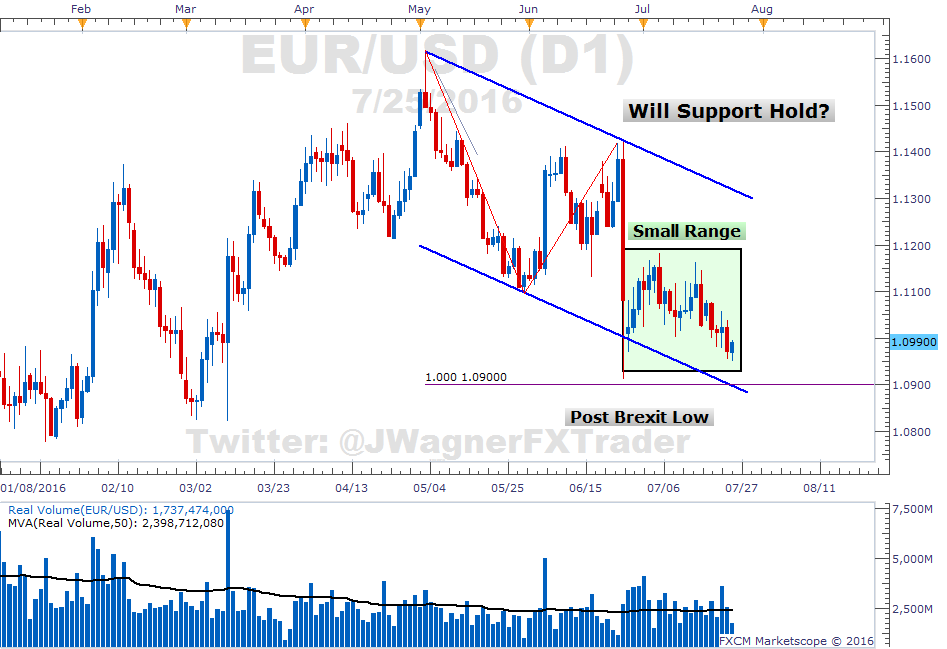
Since the day after the Brexit vote, EUR/USD has been trading in a fairly tight trading range on low volume. In fact, the highest high to the lowest low for the past 20 trading days is the tightest range seen in EUR/USD since August 2014.
Beginning June 24 to today, the highest high is 1.1185 and the lowest low price is 1.0951. Therefore, if price pushes down to 1.0900-1.0951, we could see some volatility kick up as traders jockey for bullish support versus a bearish break.
Also, with the FOMC scheduled for Wednesday afternoon, there could be a void of trading volumes to meaningfully push price in one direction or the other.
Lastly, Sentiment as measured through SSI is showing weak participation. The SSI ratio is hovering near 50% as longs and shorts are nearly equally weighted on both side. See EUR/USD trader positioning here.
All of this points towards a market condition geared towards range bound strategies in EUR/USD until we see a break of the post Brexit range of 1.0951 – 1.1185. Even still, a break of this range doesn’t necessarily negate the potential for range bound conditions.
Since we have today’s low of 1.0951 identified as a key level to watch, a trader can tune to Grid Sight Index to see how similar price action has behaved in the past.
Learn more about Grid Sight here.
Interested in a quarterly outlook for EUR or USD? Download our quarterly forecast here.
---Written by Jeremy Wagner, Head Trading Instructor, DailyFX EDU
Follow me on Twitter at @JWagnerFXTrader .
See Jeremy’s recent articles at his Bio Page.
To receive additional articles from Jeremy via email, join Jeremy’s distribution list.


