


EUR vs JPY Technical Outlook
EUR/JPY Price- A Multi-Week High
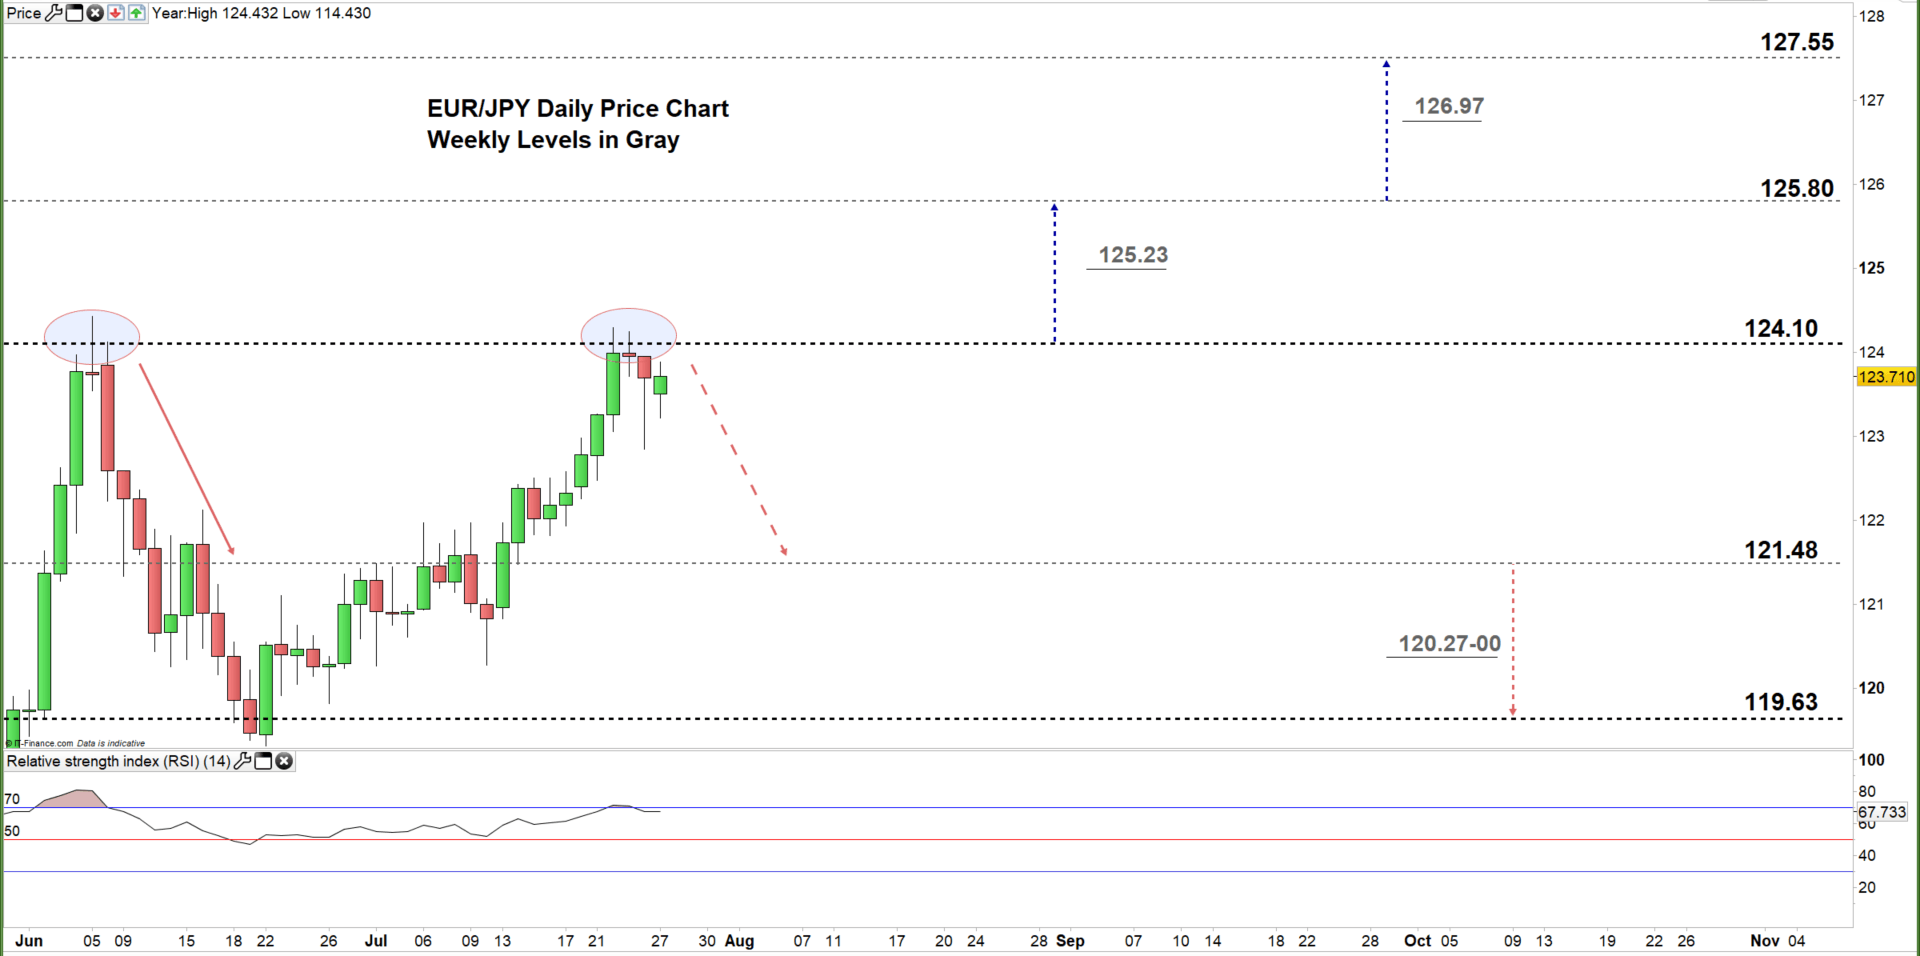
On July 22, EUR/JPY hit a near seven-week high of 124.29. However, the price retreated after as some bulls seemed to cut back. Ultimately, a weekly candlestick closed in the green with a 1.1% gain.
Alongside that, the Relative Strength Index (RSI) abandoned overbought territory highlighting a weaker bullish momentum.
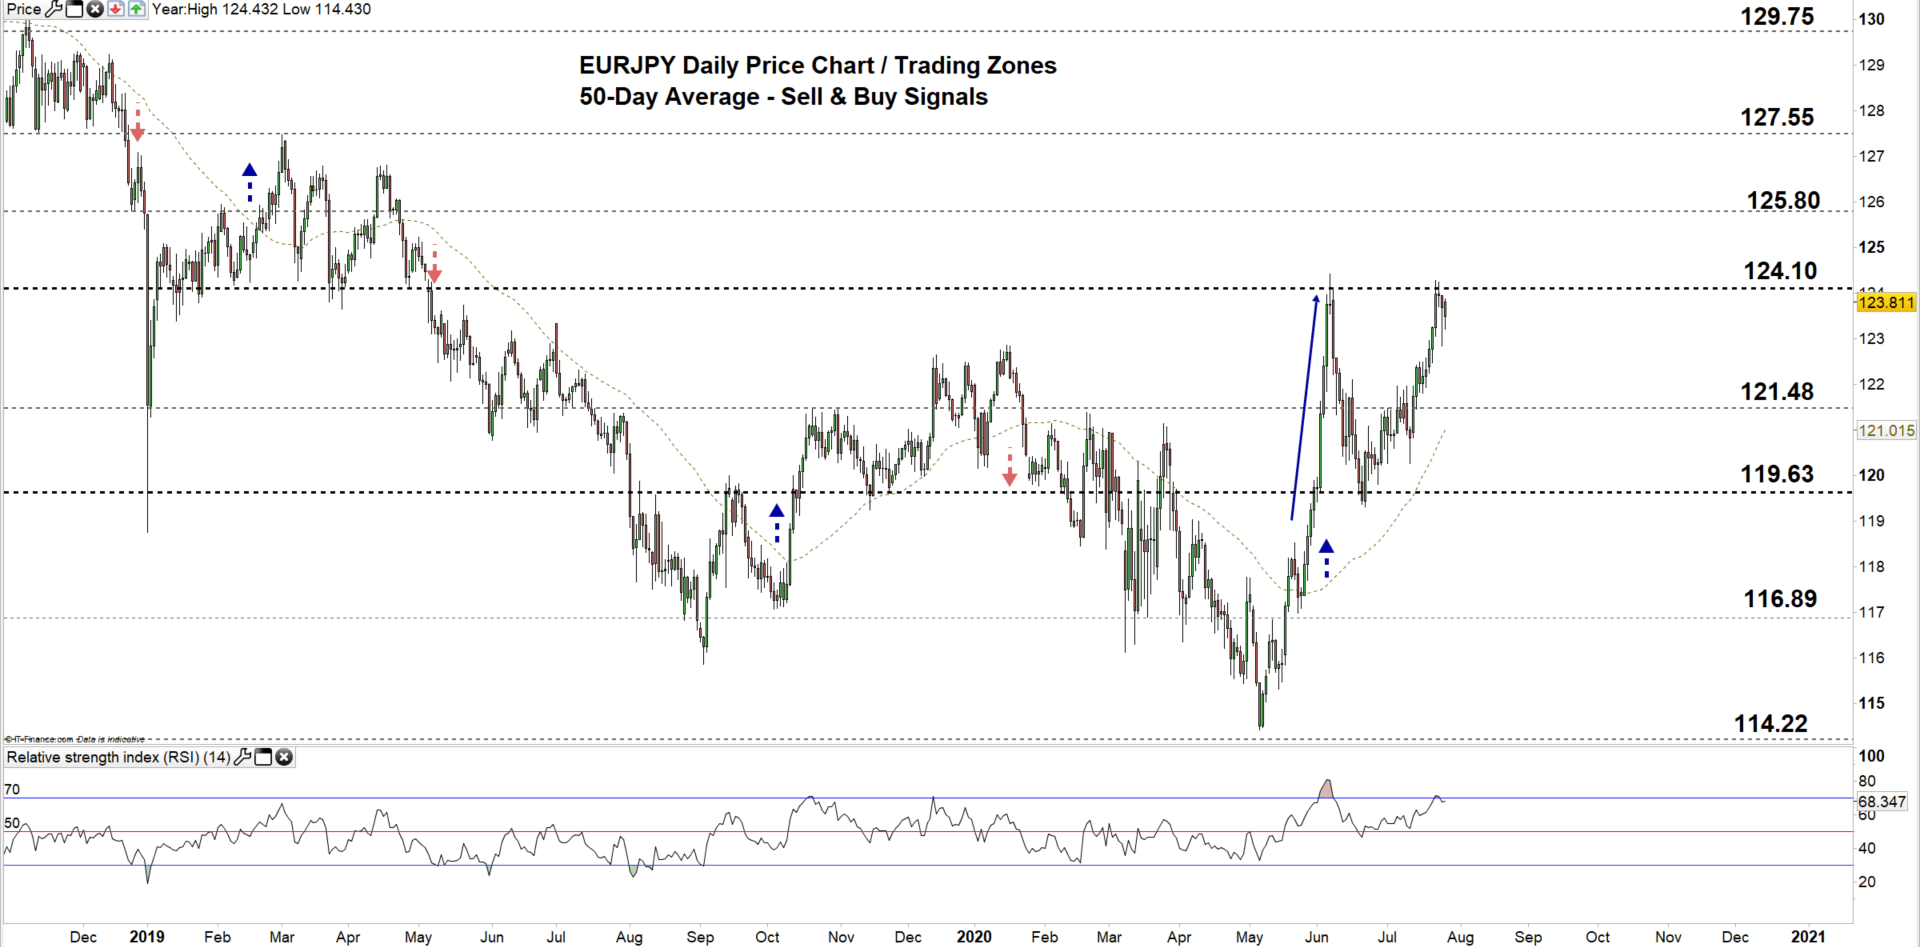
EUR/JPY Daily PRice CHART (Sep 1, 2018 – JuLY 27, 2020) Zoomed Out

EUR/JPY Daily Price CHART (April 20 – JuLY 27, 2020) Zoomed in
On June 13, EUR/JPY climbed to the current 121.48 – 124.10 trading zone. Last week, the pair failed twice to rally through the higher trading zone then traded lower in a similar way to what happened in early June indicating that bulls were losing steam.
A daily close above the high end of the current trading zone may encourage bulls to steer EURJPY towards the monthly resistance at 125.80 ( May 2017 high).
On the other hand, a failure in closing above the high end of the zone may ultimately guide EURJPY’s fall towards the weekly support level at the low end of the current trading zone.

EUR/JPY Four Hour Price CHART (June 13 – JuLY 27, 2020)
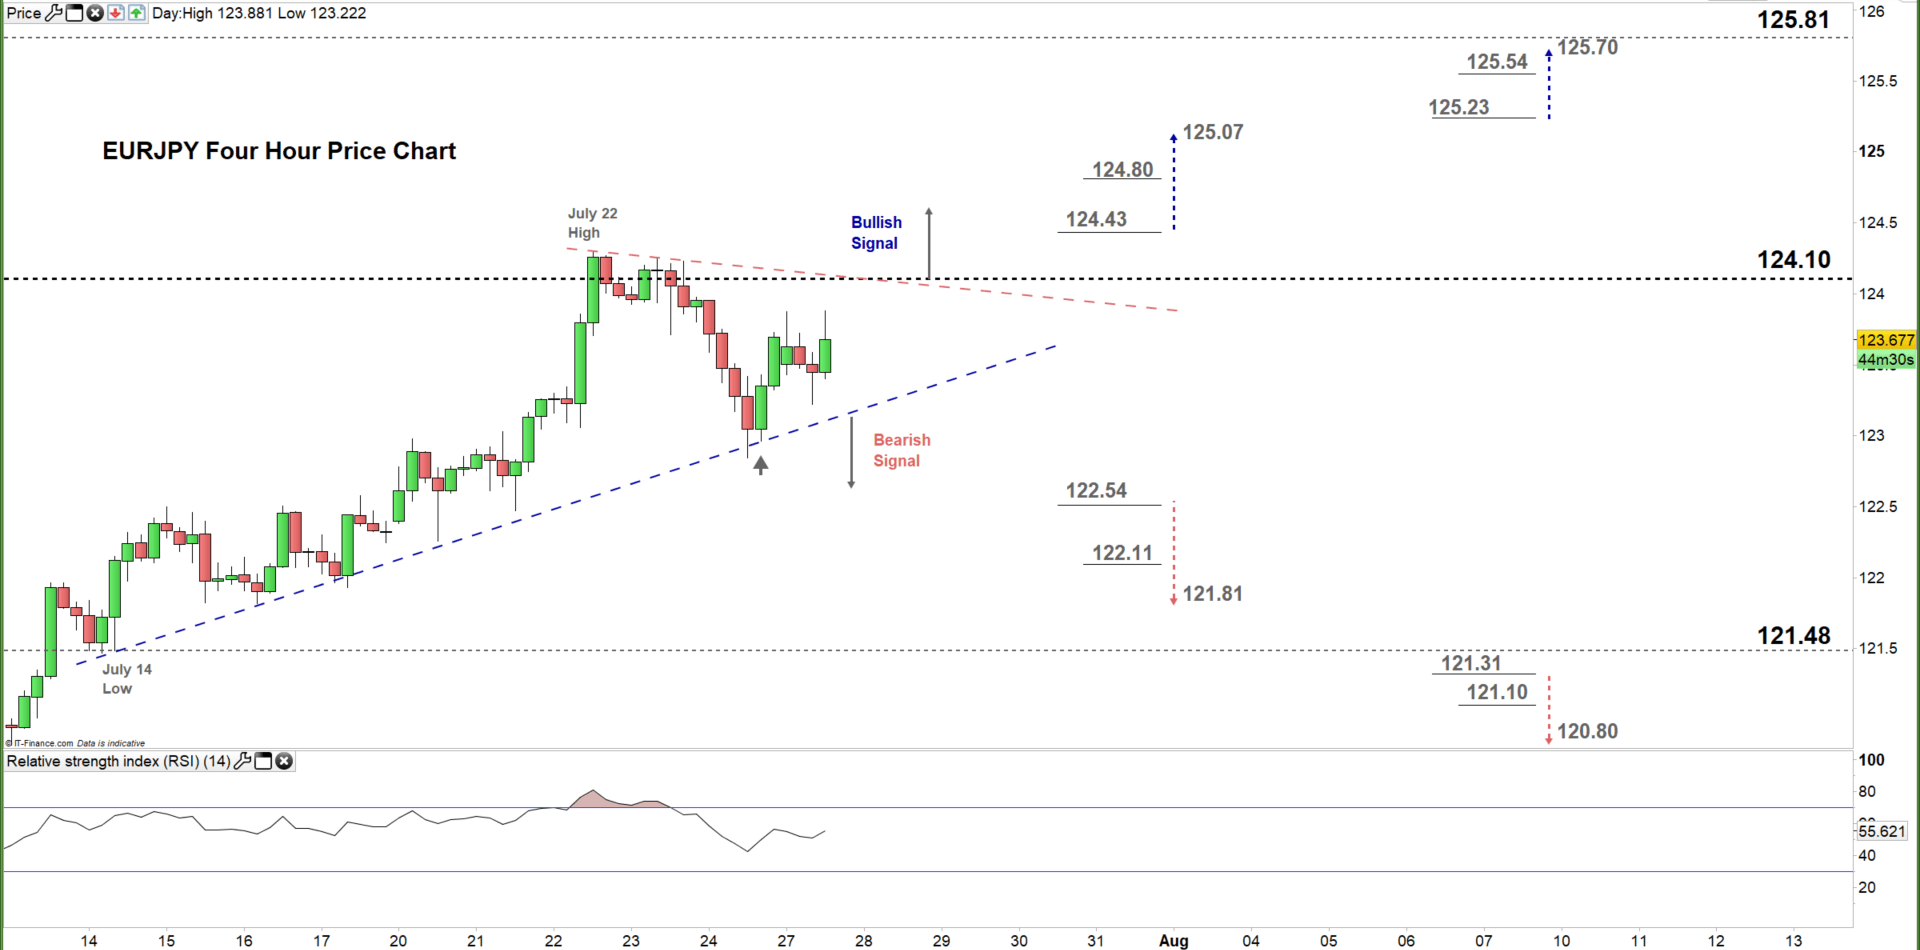
On Friday, EUR/JPY rebounded twice from the bullish trendline support originated from the July 14 low at 121.47, indicating that bulls were still in charge.
To conclude, while the bullish bias is still in place a break below the aforementioned bullish trendline reflects a weaker upward sentiment. Therefore a break below 122.54 could send EURJPY towards 121.81, while a break above 124.43 may trigger a rally towards the 125.07. As such, the daily support and resistance levels marked on the four-hour chart should be monitored.
Written By: Mahmoud Alkudsi, Market Analyst
Please feel free to contact me on Twitter: @Malkudsi


