


EUR vs JPY Technical Outlook
EUR/JPY Price- Rallied to a Multi-Week High
On Friday, EUR/JPY hit an over five-week high of 122.57 then retreated after as some bulls seemed to cut back. Ultimately, the weekly candlestick closed in the green with a 1.2% gain.
Last week, Euro rallied on the back of positive news of Coronavirus vaccine trials combined with hopes of achieving a recovery fund deal in the EU summit. The European leaders failed this weekend to bridge the gap between their differences.
EUR/JPY Daily PRice CHART (Sep 1, 2018 – JuLY 20, 2020) Zoomed Out


EUR/JPY Daily Price CHART (April 20 – JuLY 20, 2020) Zoomed in
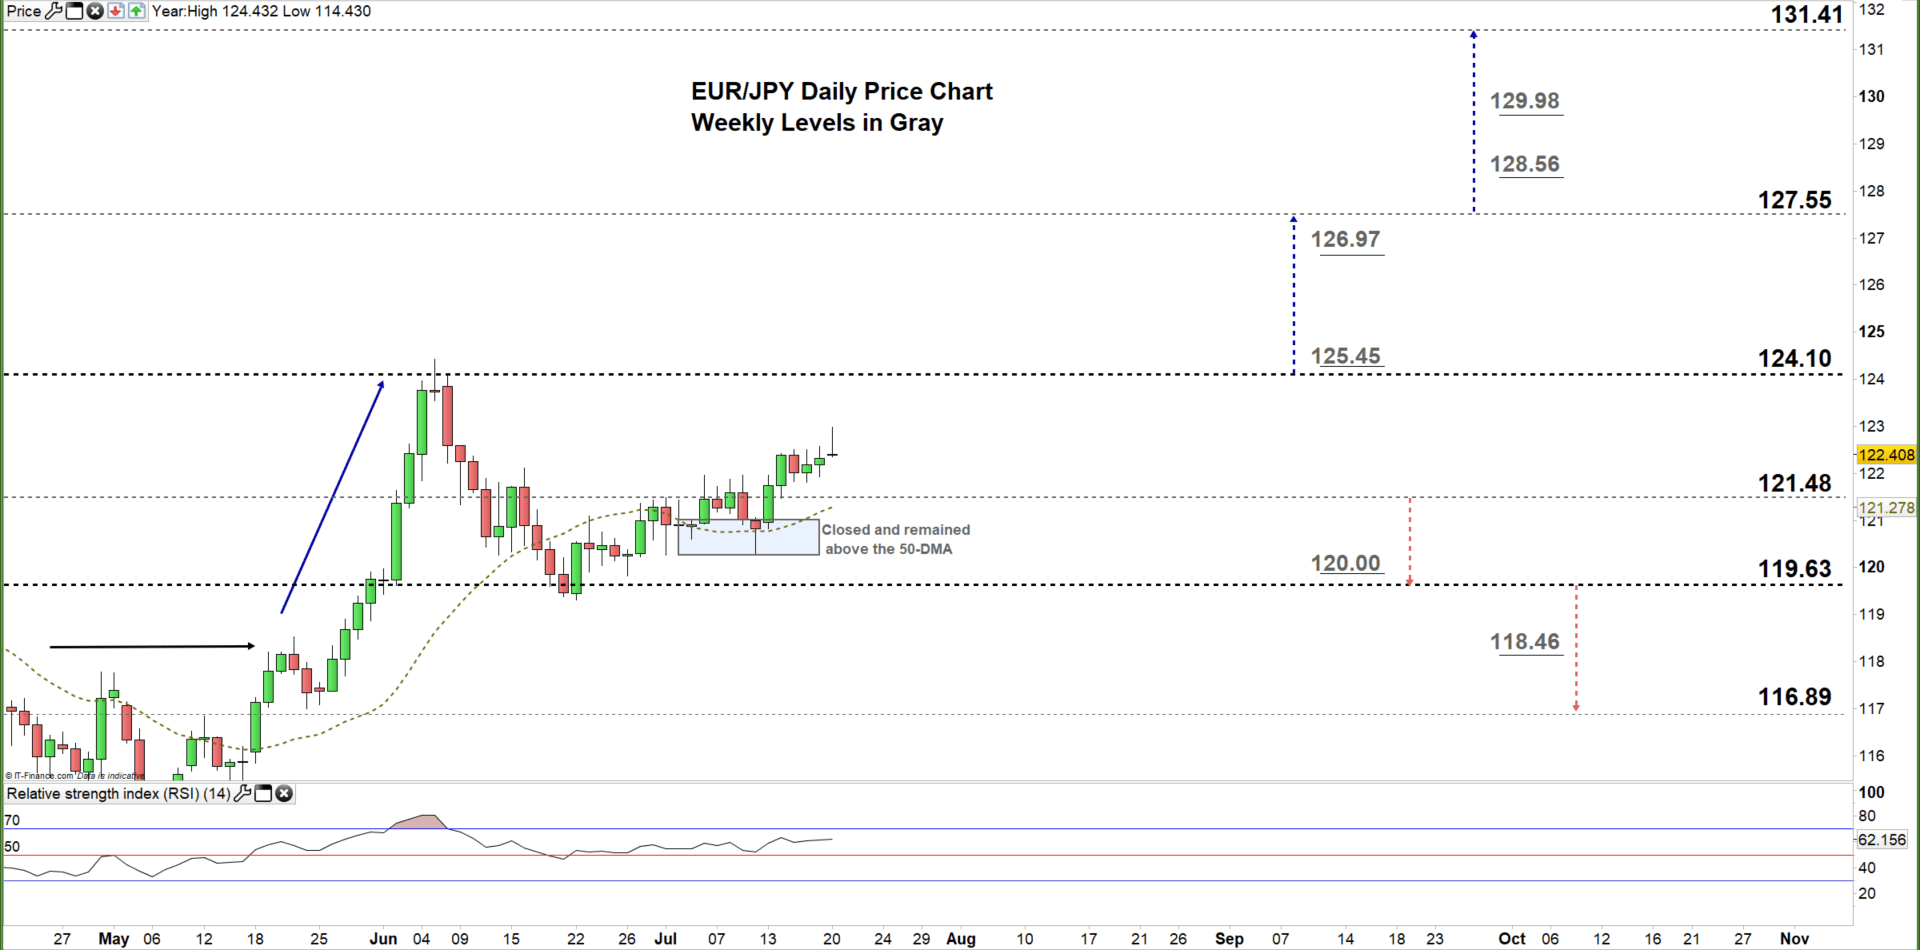
On July 6, EUR/JPY closed above the 50-day moving average and since then, the price has failed on multiple occasions to close below this indicator, repeatedly rebuffing efforts to put bears in charge. Last week, the pair climbed and remained in the current trading zone 121.48 – 124.10.
A close above the high end of the zone at 124.10 could open up a push behind EURJPY towards the monthly resistance at 127.55, and a further close above that may encourage bulls to extend the rally towards 131.41.
On the other hand, a close below the low end of the zone at 121.48 may ultimately guide EURJPY’s fall towards the weekly support at 119.63, and a further close below that level could embolden bears to revisit the monthly support level at 116.89.

EUR/JPY Four Hour Price CHART (June 4 – JuLY 20, 2020)

On Tuesday, EUR/JPY broke above the July 9 high at 121.96 and started an uptrend move creating higher highs with higher lows. Any break above the downside trendline resistance would generate a further bullish signal, while a break below the uptrend line support originating from the July 14 low at 121.48 may keep the bearish potential alive.
To conclude, a break above 124.96 may trigger a rally towards the 125.80, while a break below 122.09 could send EURJPY towards 121.48. As such, the daily support and resistance levels marked on the four-hour chart should be considered.
Written By: Mahmoud Alkudsi, Market Analyst
Please feel free to contact me on Twitter: @Malkudsi


