


EUR/USD and EUR/JPY Outlook
- US Dollar and Japanese Yen price action against Euro
- EUR/JPY, EUR/USD trading lower
See Our latest trading guides for free and discover what is likely to move the markets through Q3 of this year.
EUR/JPY, EUR/USD Closed in the Green
On Sep 3, EUR/USD declined to 1.0926 – its lowest level in over 27 months. However, the price rallied after and closed the weekly candlestick above 1.1000 handle with a 0.4% gain.
Similarly, EUR/JPY U-turned after printing 115.86 - its lowest level in over 28 months. The pair closed on Friday the weekly session with a 0.9% gains for the first time in nine weeks.
Alongside this, the Relative Strength Index (RSI) reversed direction before dipping in oversold territory on both pairs however, remained below 50 indicating to buyer’s lack of momentum at this stage to kick start uptrend move.
Having trouble with your trading strategy? Need a hand? Here’s the #1 Mistake That Traders Make
EUR/USD Daily PRice CHART (May 1, 2018 - SEp 9, 2019) Zoomed Out

EUR/USD Daily Price CHART (June 12 – Sep 9, 2019) Zoomed in
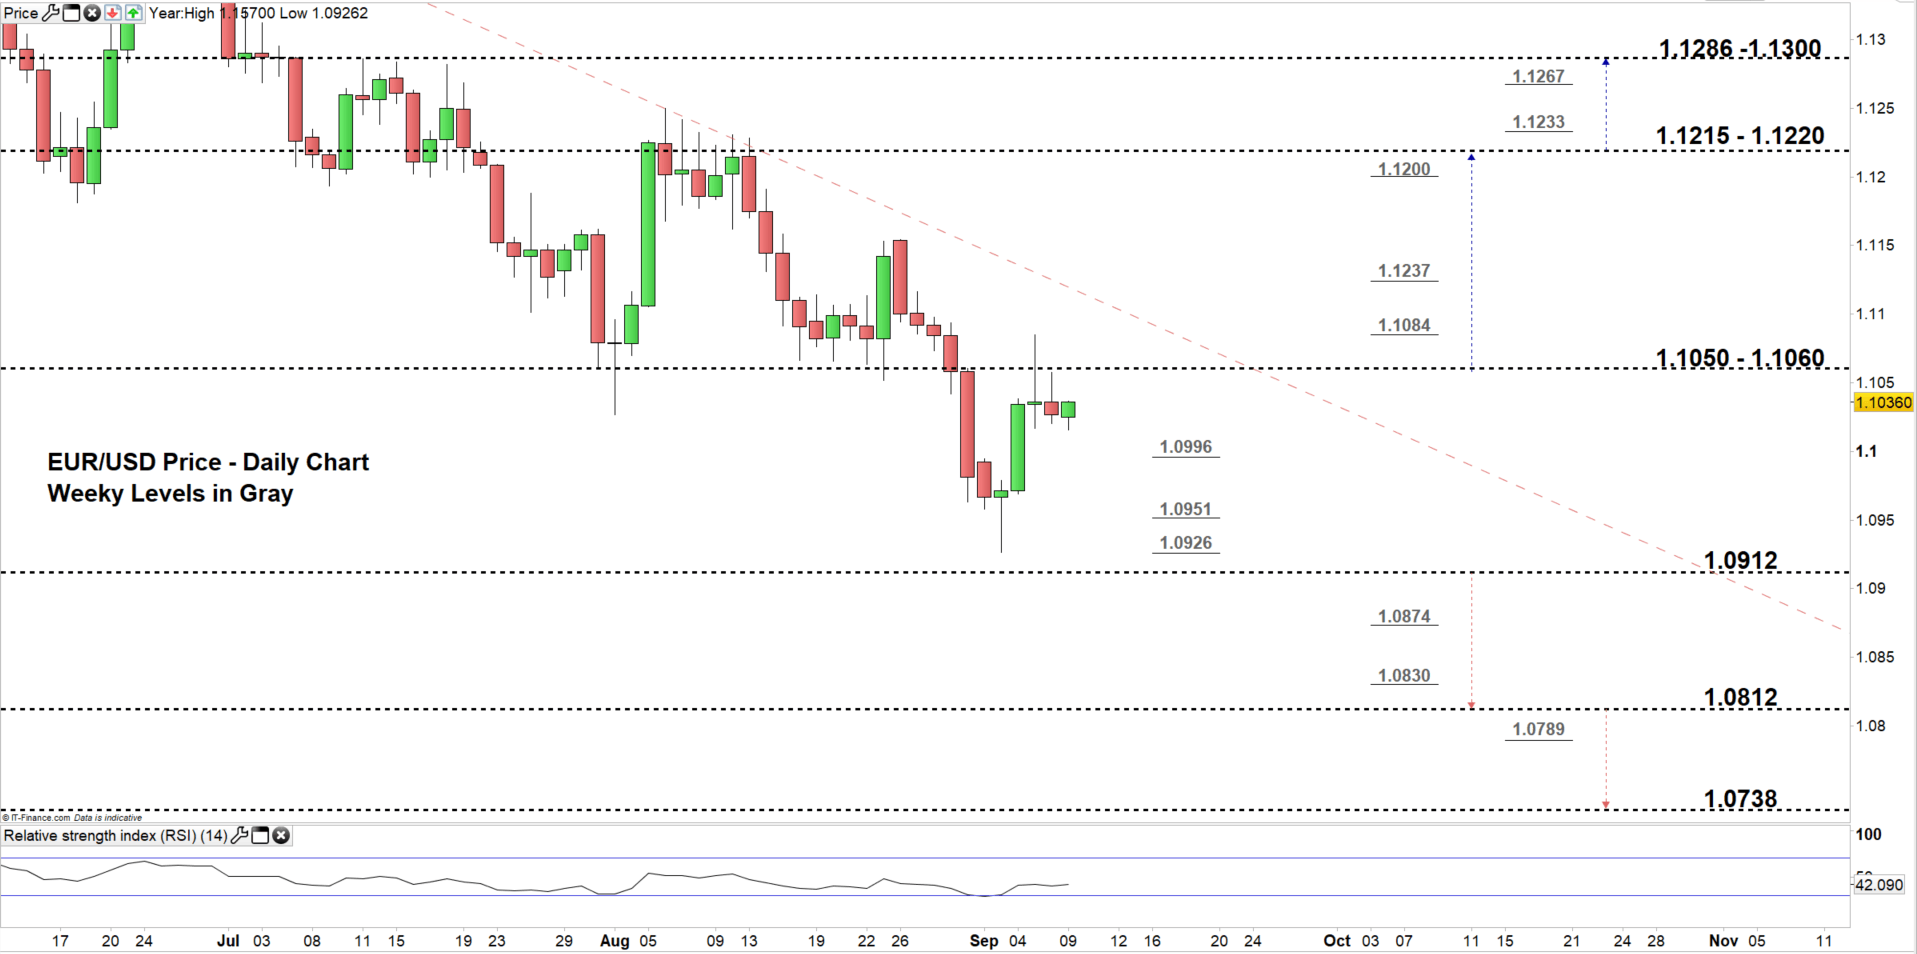
Looking at the daily chart we notice, on Aug 30 EUR/USD entered a lower trading zone 1.1060 -1.0912. On Tuesday, the pair U-turned and rallied in the following days towards the high end of the zone although, failed to move to the higher zone.
Thus, EURUSD could be on its way for a test of the low end of the zone, contingent on clearing the weekly support levels underlined on the chart (zoomed in). Further close below the low end may continue bearish price action towards 1.0812. That said, sellers would need to pay a close attention to the weekly support levels underscored on the chart where the price may change direction to the upside.
On the other hand, any failure to close above the low end of the zone might reverse the pair’s course and send it back to the high end. Further close above the high end could push the price towards the vicinity of 1.1215-20. Although, the weekly resistance levels underline on the chart would be worth monitoring.
Just getting started? See our Beginners’ Guide for FX traders
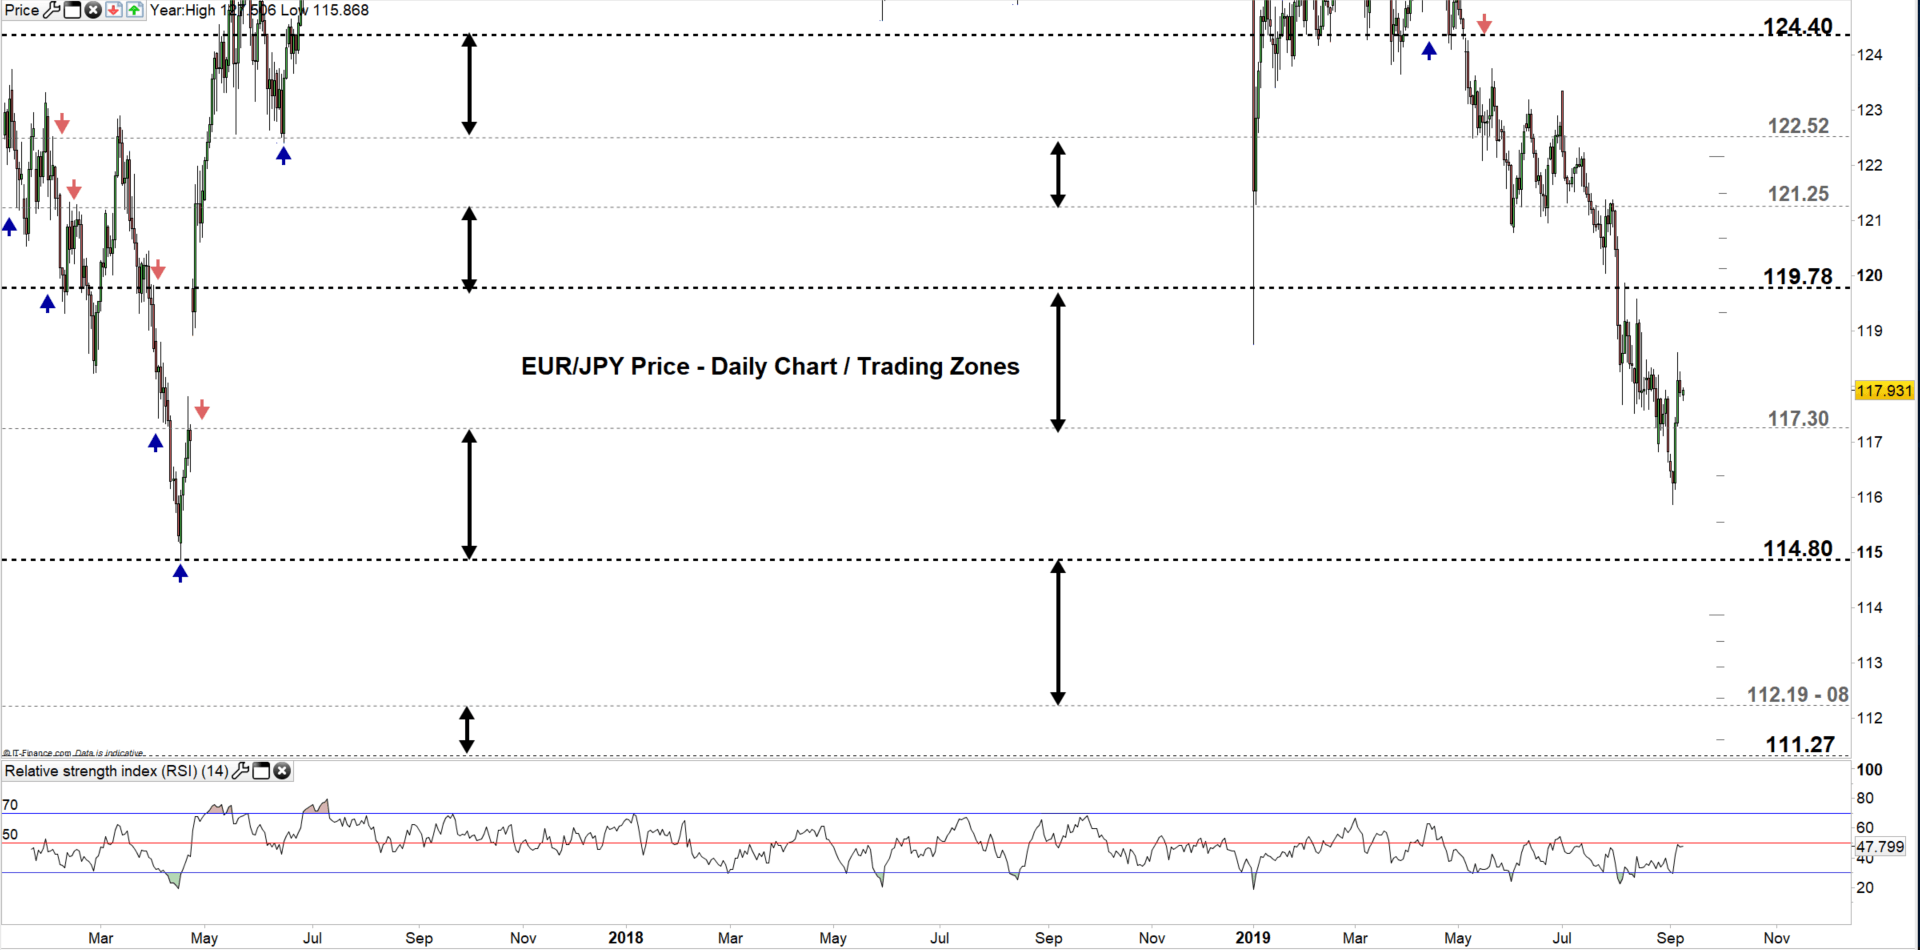
EUR/JPY Daily PRice CHART (Jan 2, 2017– Sep 9, 2019) Zoomed Out
EUR/JPY Daily PRice CHART (June 1 – SEp 9, 2019) Zoomed In
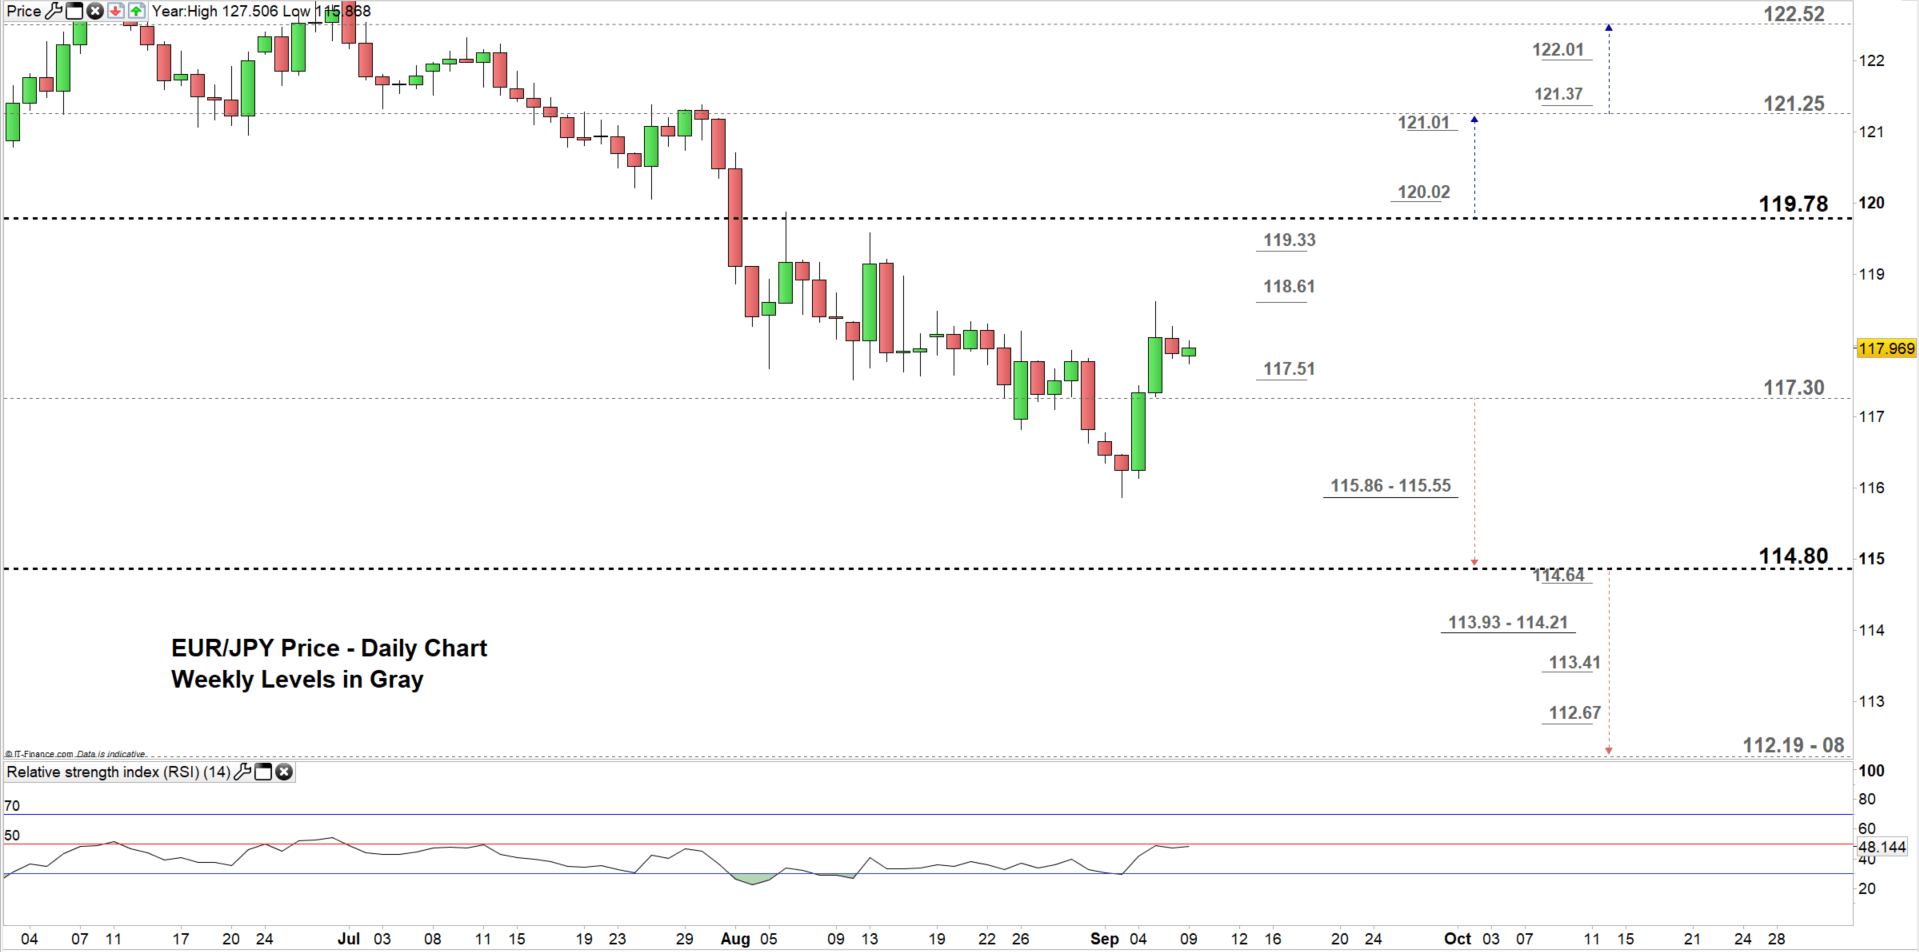
From the daily chart we notice, on Wednesday EUR/JPY rallied to a higher trading zone 117.30 – 119.78 eyeing a test of the high end of it.
Hence, a close above the high end may continue bullish price action towards 121.25. Nonetheless, the weekly resistance levels underlined on the chart (zoomed in) need to be kept in focus.
On the flip-side, any failure to close above the high end of the zone could send EURJPY back to the low end. Further close below the low end might send the price towards 114.80. However, the weekly support area marked on the chart needs to be watched closely.
Written By: Mahmoud Alkudsi
Please feel free to contact me on Twitter: @Malkudsi


