


EUR and USD Price Forecast
See Our latest trading guides for free and discover what is likely to move the markets through Q3 of this year.
USDJPY, EURJPY Price Action
Last week Euro declined against Japanese Yen. EUR/JPY tumbled to its lowest level in 28 months at 117.51, then closed the weekly candlestick with only 0.3% loss. In turn, US Dollar firmed slightly leading USD/JPY to close with 0.6% gain. This week, both pairs opened with an upward gap.
The Relative Strength Index (RSI) abandoned the oversold territory and climbed to 41 on EURJPY and on USDJPY then remained flat after reflecting the market indecision at this stage, with the seller’s loss of momentum and the buyer’s inability to lead the price.
Having trouble with your trading strategy? Need a hand? Here’s the #1 Mistake That Traders Make
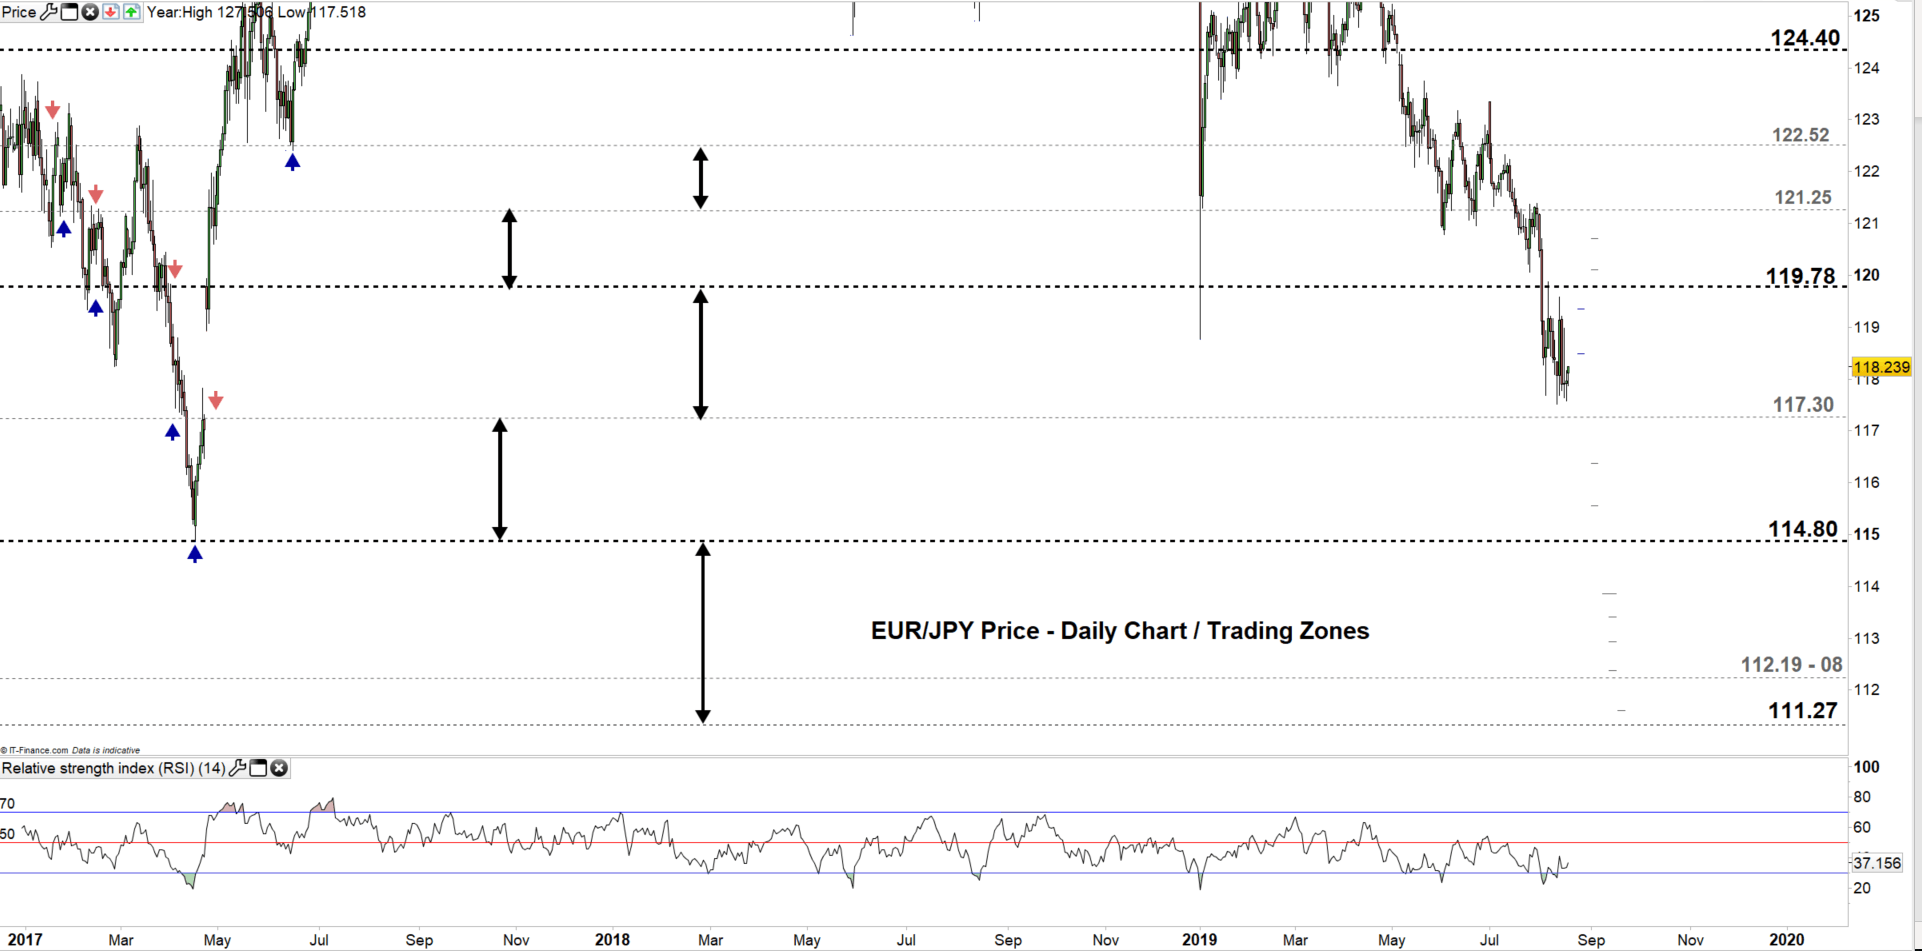
EUR/JPY Daily PRice CHART (Jan 1, 2017 - AUG 19, 2019) Zoomed Out
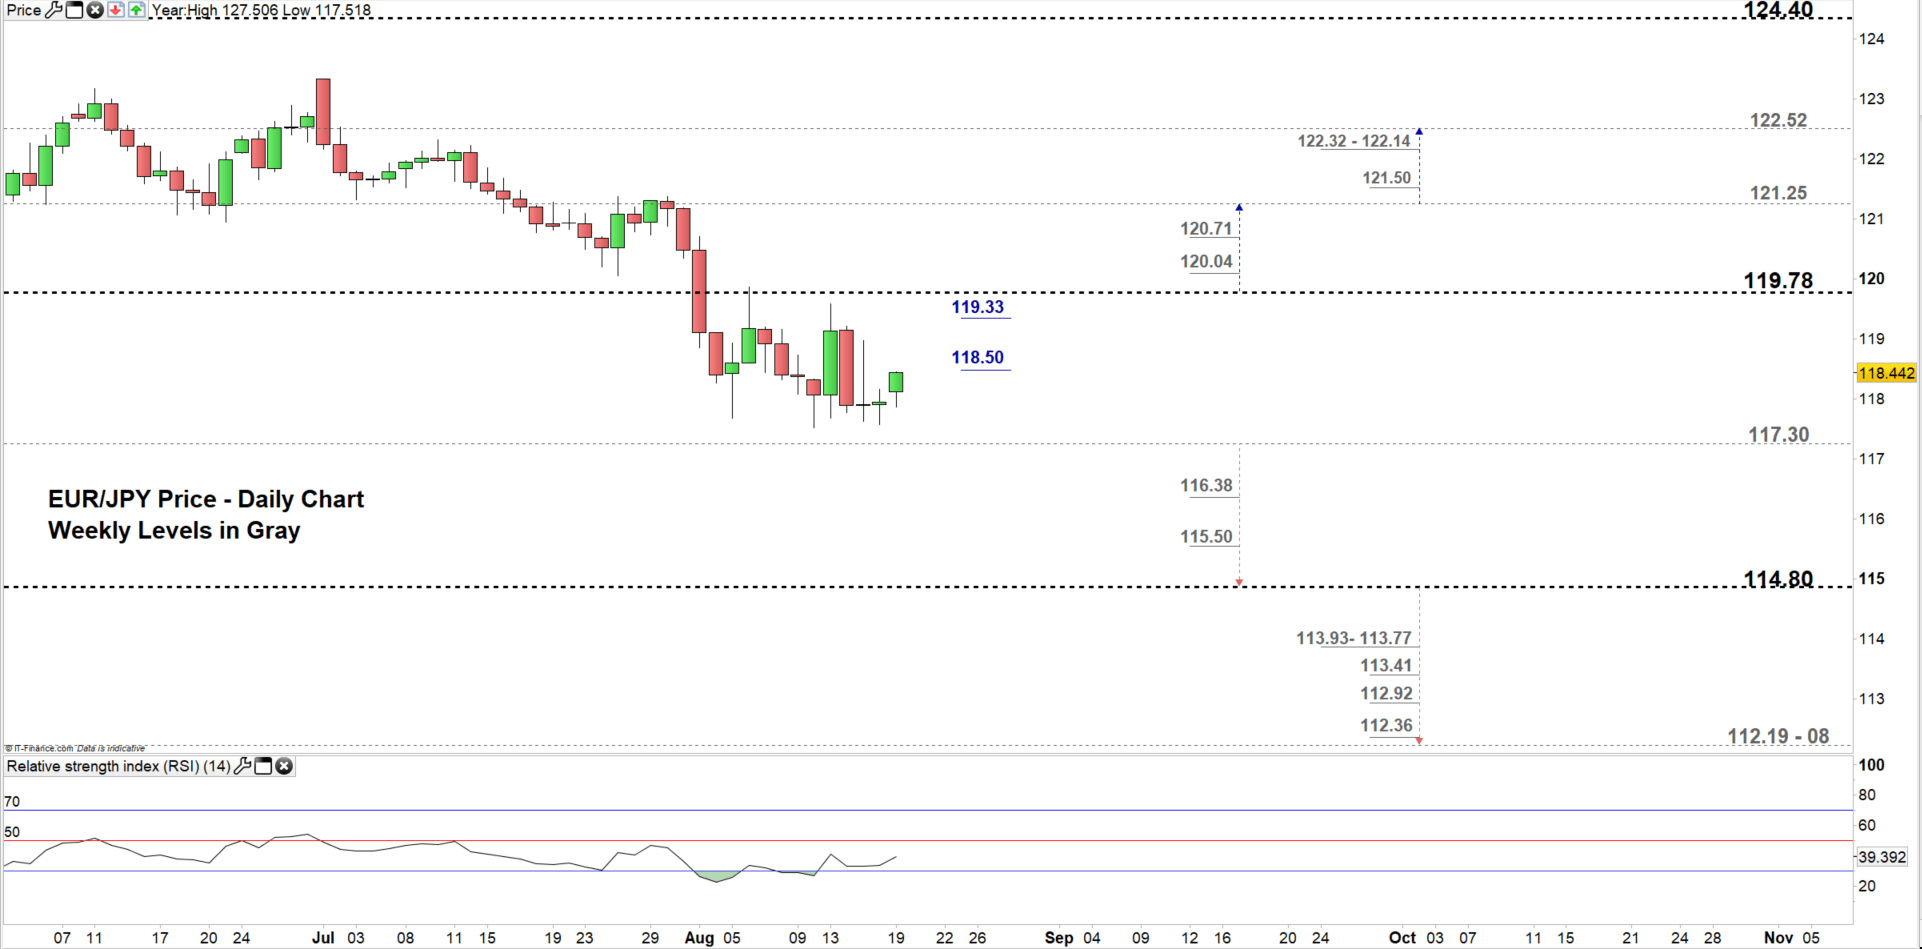
EUR/JPY Daily Price CHART (JUNE 4 - AUG 19, 2019) Zoomed in
Looking at the daily chart we notice on August EUR/JPY failed to close above the high end of current trading zone 117.30 – 119.78. Since then the pair has been trading ineffectively.
Thus, any close below the low end could resume bearish price action and send EURJPY towards 114.80. Although, the weekly support levels underscored on the chart (zoomed in) need to be considered. See the chart to know more about the lower trading zone with the weekly support levels the price would face below 114.80.
On the flip-side, the pair needs to clear the daily resistance levels underlined on the chart before rallying for a test of the high end of the zone. Any close above the high end could push EURJPY towards 121.25. However, the weekly resistance levels would be worth monitoring.
Just getting started? See our Beginners’ Guide for FX traders
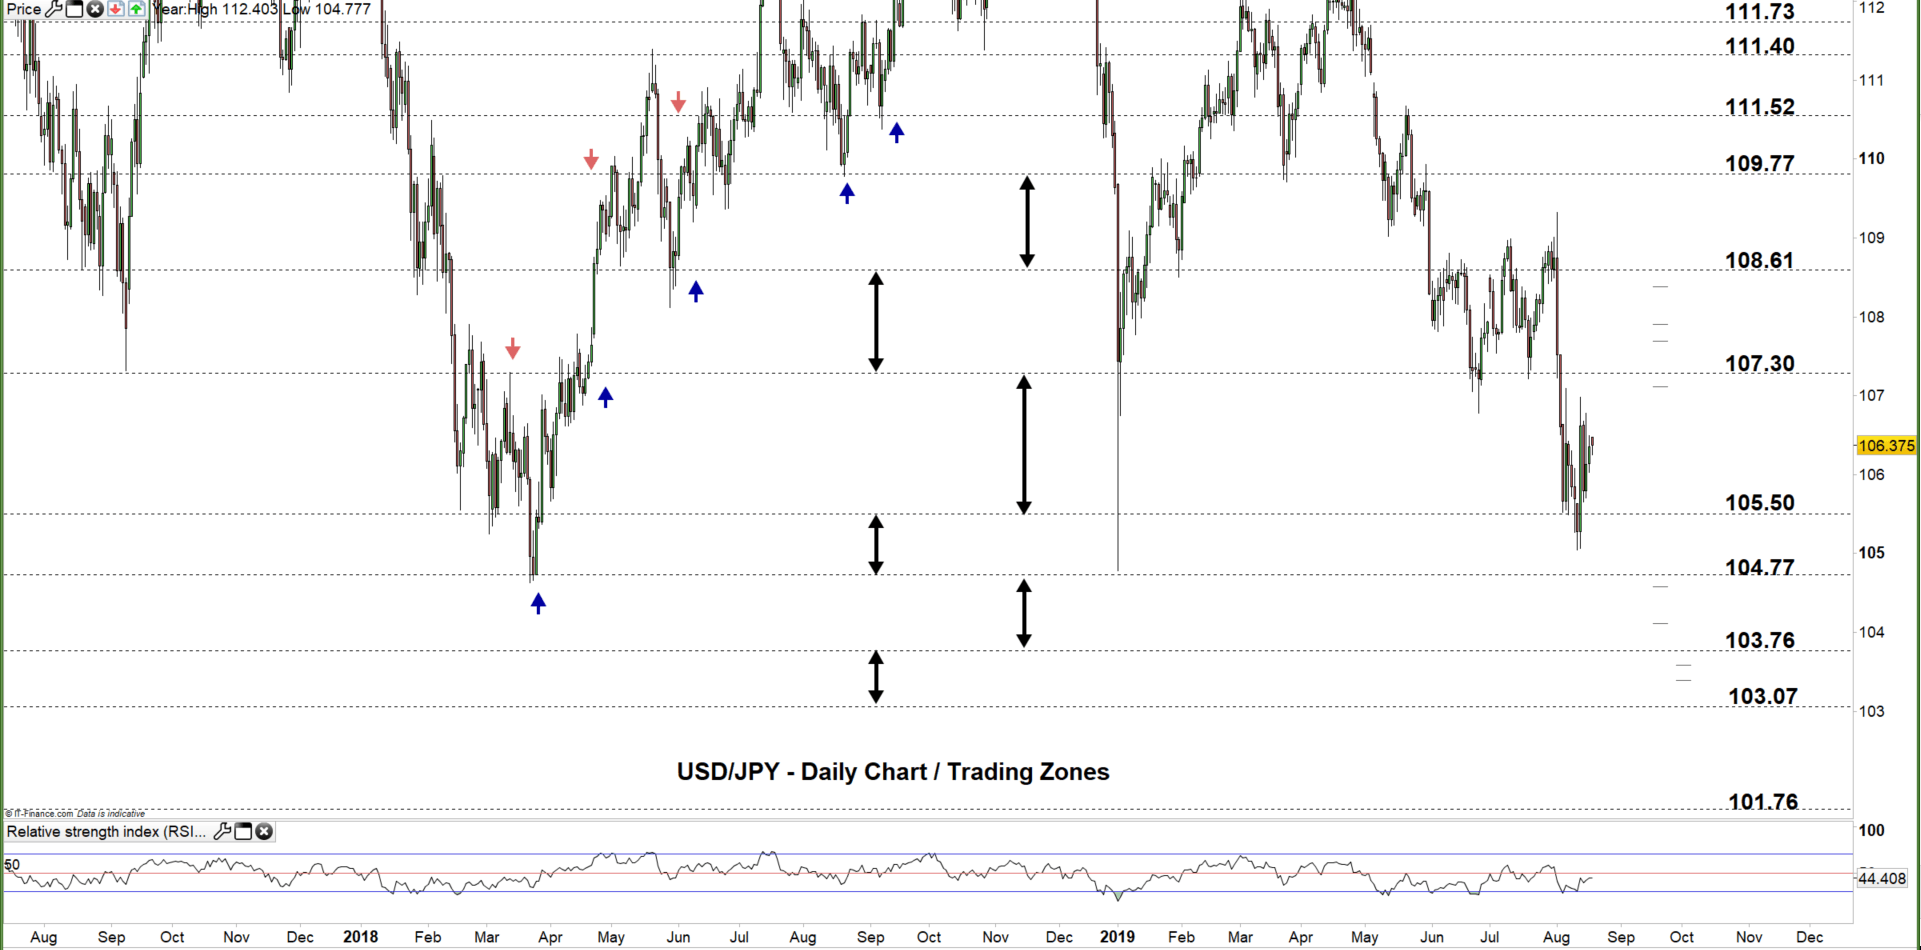
USD/JPY Daily PRice CHART (JULY 18, 2017– AUG 19, 2019) Zoomed Out
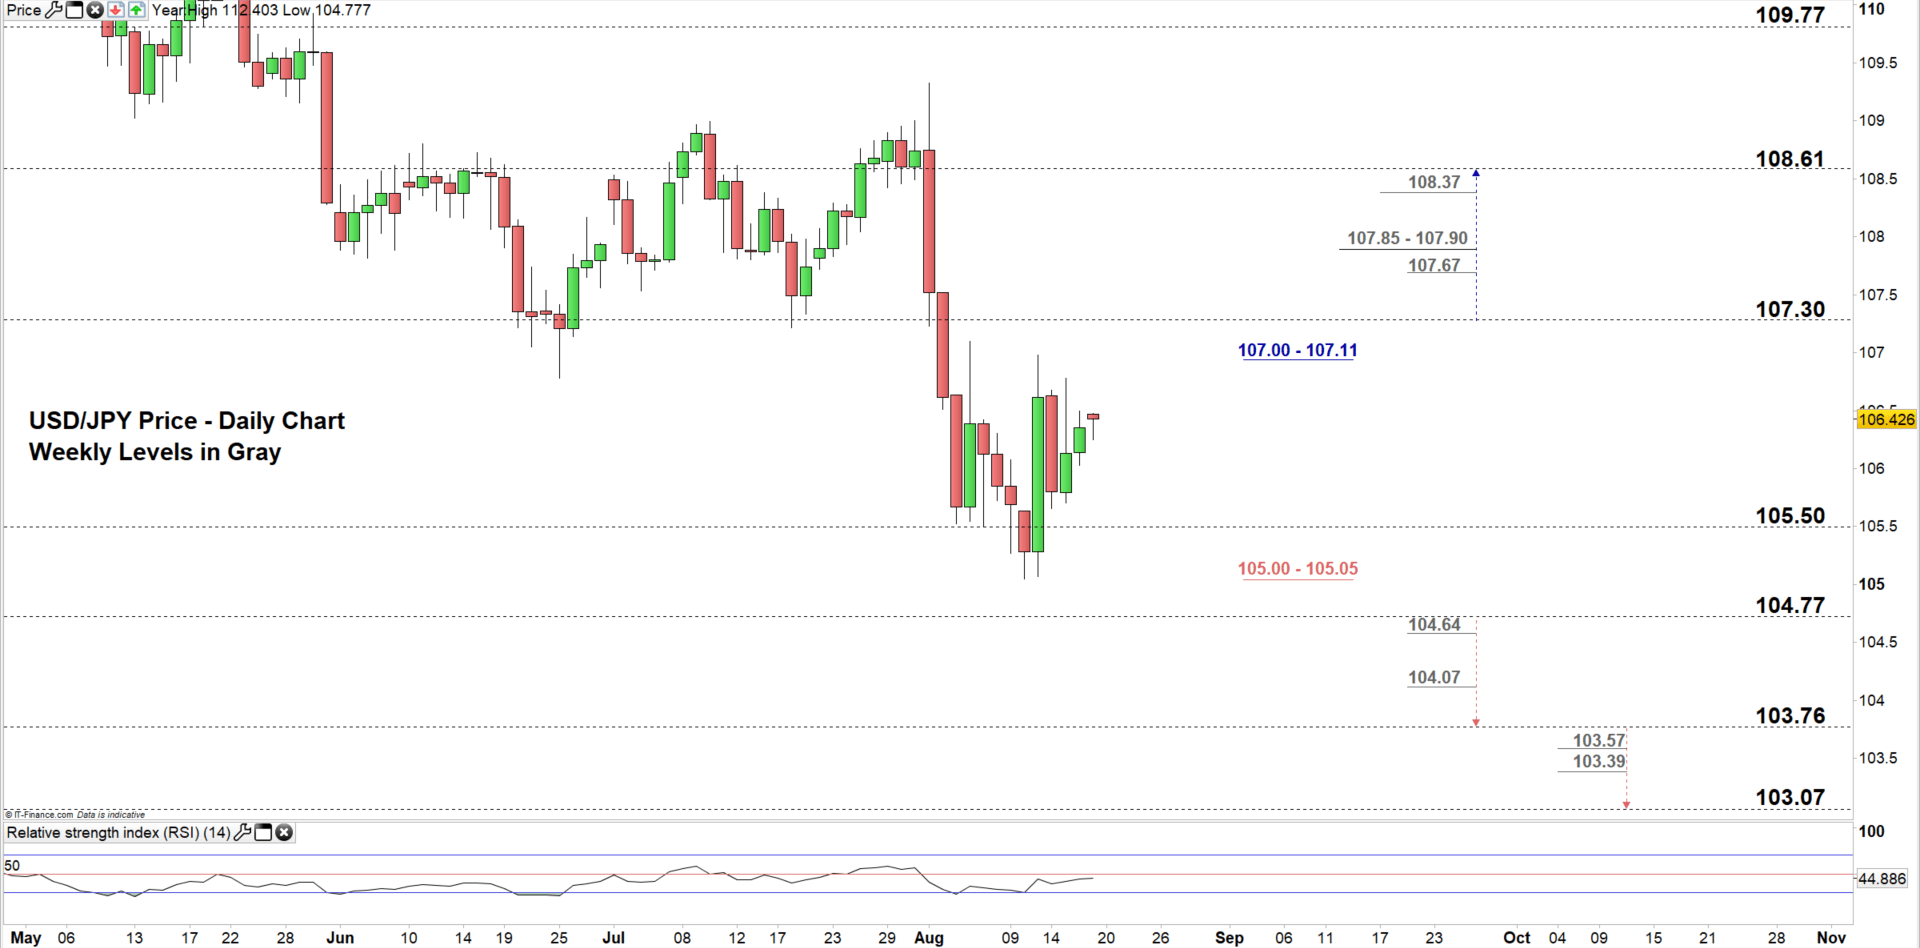
USD/JPY Daily PRice CHART (MAy 1 – AUG 19, 2019) Zoomed In
Looking at the daily chart we notice on Tuesday USD/JPY rebounded nearby 107.00 handle, since then the pair settled in the same old trading zone 105.50 -107.30.
The price needs to clear the daily resistance area marked on the chart (zoomed in) before testing the high end of the zone. Any close above the high end could push USDJPY towards 108.61. Although, the weekly area and levels underlined on the chart should be kept in focus.
On the other hand, any failure in closing above the high end of current trading zone could send the price towards the low end. Further close below the low end may press USDJPY towards 104.77. Nonetheless, the daily support area marked on the chart needs to be watched closely.
Written By: Mahmoud Alkudsi
Please feel free to contact me on Twitter: @Malkudsi


