


EUR/JPY Price Outlook, Charts and Analysis
See our EUR and JPY guides and find out for free what is likely to move market prices through Q2 from Main Currencies and Commodities Forecasts
EUR/JPY– From Bullish to Bearish
On June 11, EUR/JPY failed to create a higher high marking the lack of momentum to keep pushing higher. Instead, the pair created a lower high at 123.18.
Alongside, on June 11 the Relative Strength Index (RSI) crossed above then returned below 50 showing the weakness of the bulls and indicating to the bears preparing to take charge.
Having trouble with your trading strategy? Need a hand? Here’s the #1 Mistake That Traders Make
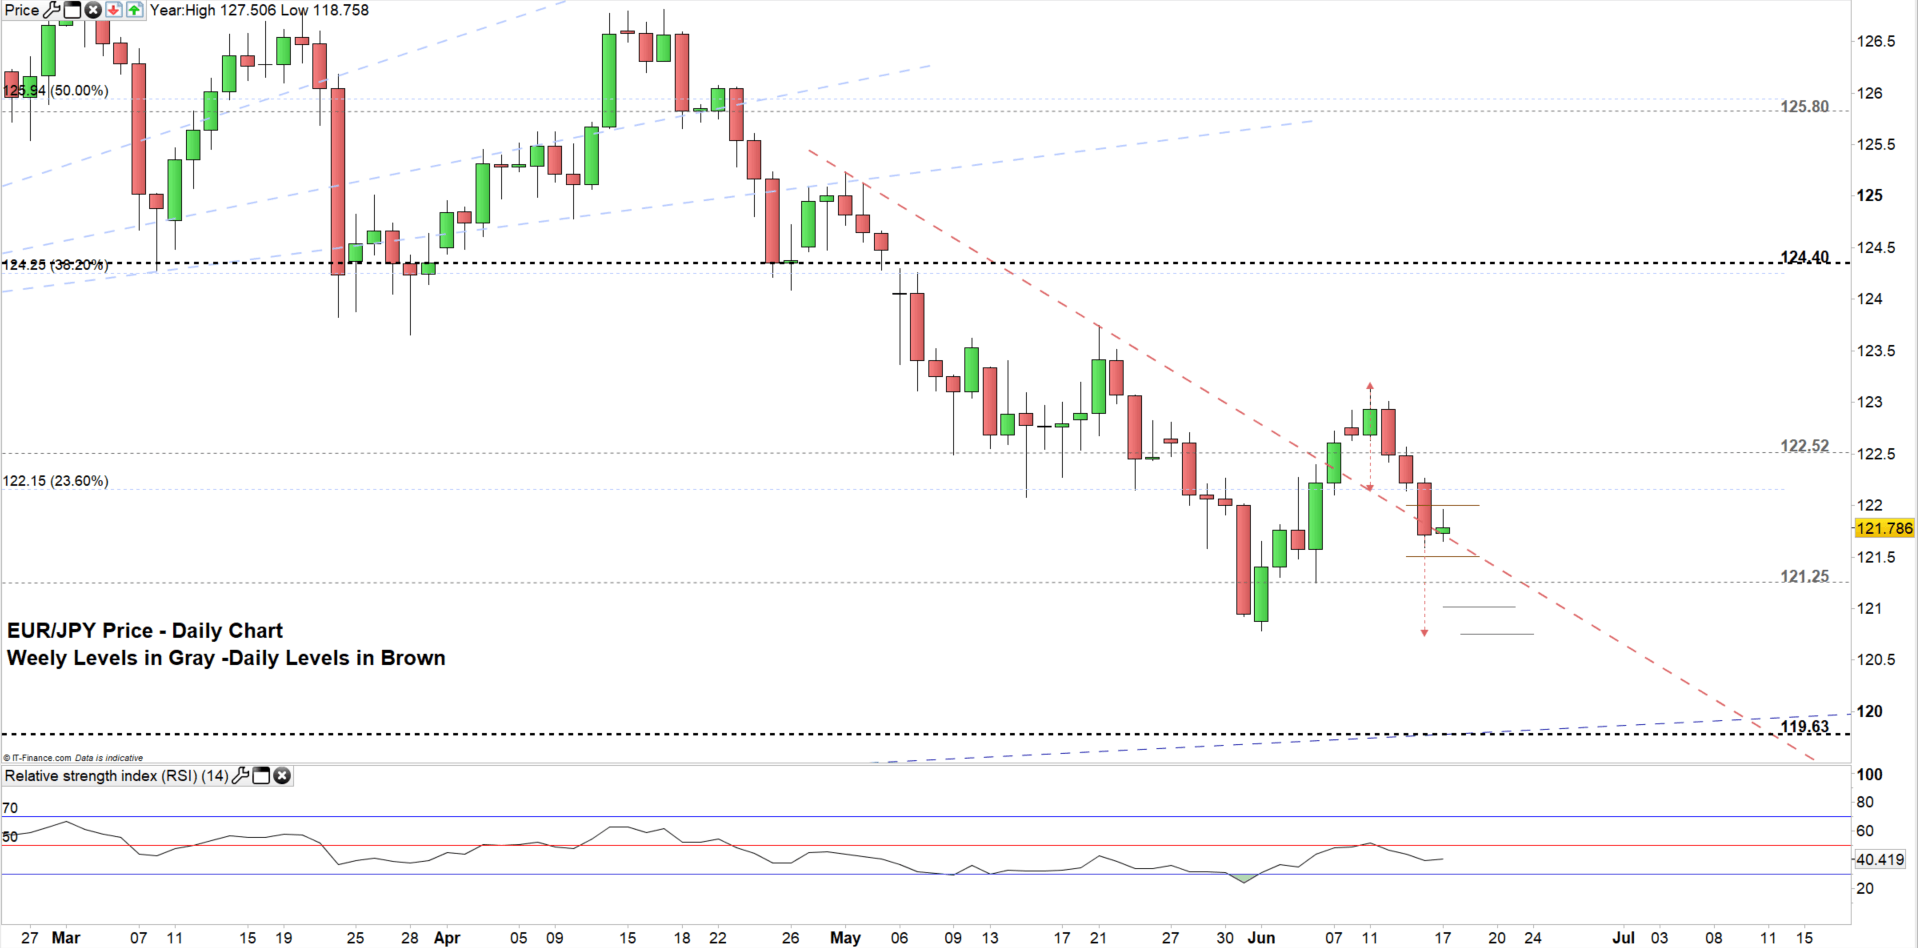
EUR/JPY DAILY PRICE CHART (FEB 26, 2019- JUN 17, 2019) Zoomed IN
EUR/JPY DAILY PRICE CHART (DEC 27, 2016 - JUN 17, 2019) Zoomed OUT

Looking at the daily chart we notice EUR/JPY on Jun 12 closed below 122.52 eying to test the low end of the trading zone (122.52 – 121.25). A close below the June 3 low at 120.78 may embolden the bears to press towards 119.63. However, the weekly support zone 120.47 – 120.22 would be worth monitoring.
In turn, a failure to close below 121.25 may send the price towards 122.52. Although, daily resistance zone at 122.00 – 26.6% Fibonacci retracement at 122.15 need to be kept in focus.
Just getting started? See our Beginners’ Guide for FX traders
EUR/JPY Four-HOUR PRICE CHART (May 30 – JUNE 17, 2019)

Looking at the four-hour chart, we notice the descending course of EUR/JPY since Jun 11. The bears might keep pressing towards the end of the trading zone mentioned above, hence if the price tumbles below 121.25 then it could continue towards the June 3 low at 120.78. The weekly support at 121.00 should be watched closely.
On the other hand, if EUR/JPY breaks above 23.6% Fibonacci retracement at 122.15 then it could rally towards 122.52. The daily resistance at 122.42 needs to be considered. See the chart for more key levels if the rally continues above 122.52.
Written By: Mahmoud Alkudsi
Please feel free to contact me on Twitter: @Malkudsi


